Example page
Lorem Ipsum
The CloudWatch Mule® Integration is an agent-based integration.
The CloudWatch Mule® Integration does a license check via SSL and hence it requires outbound access to:
On-prem Mule servers must be registered in Anypoint Runtime Manager (ARM) to be able to collect data. The RM Agent comes in the /bin folder of the Mule runtime, then you can perform the command in CLI. See instructions in https://docs.mulesoft.com/runtime-manager/servers-create.
Any server that’s registered in a group or cluster in ARM must be able to gather metrics from those as well.
In order for the agent to properly connect to ARM in Anypoint, specific network configuration must be allowed. All DNS names, ports and IPs needed to hook the agent are documented in https://docs.mulesoft.com/runtime-manager/rtm-agent-whitelists.
Given the cloud nature of applications deployed to CloudHub, all application and server metadata is intrinsically stored by default on Anypoint Control Plane. No special configuration is required other than the needed permissions in the connected app.
The CloudWatch Mule® Integration must have an internet connection on port 443 for outbound connections at least.
In enterprises, it’s very common that all networks are behind a firewall to protect access. In many other cases, reverse proxies are used to protect outbound communications to restricted websites. Customers must configure rules in the firewall and proxies to ensure the communication to all IO Connect Services, Anypoint and CloudWatch.
The CloudWatch Mule® Integration does a license check via SSL and hence it requires outbound access to:
This is an outbound communication only and it’s initiated by the CloudWatch agent running on-premise.
Communication from Mule servers, installed on-prem, must allow inbound and outbound connections to the following DNS names via port 443 (HTTPS) and 9999 (configurable websocket).
Here is a full list of the FQDNs that need to be whitelisted. Pick the ones corresponding to the region to which you MuleSoft organization belongs to.
Learn more about the MuleSoft Anypoint networking requisites in https://docs.mulesoft.com/runtime-manager/rtm-agent-whitelists
Communication from the CloudWatch agent is via port 443 (HTTPS).
CloudWatch Mule® Integration offers seven dashboards and thirteen monitors for comprehensive visualization and management of your infrastructure resources. Metrics collected serve as the basis for the insights provided by these tools.
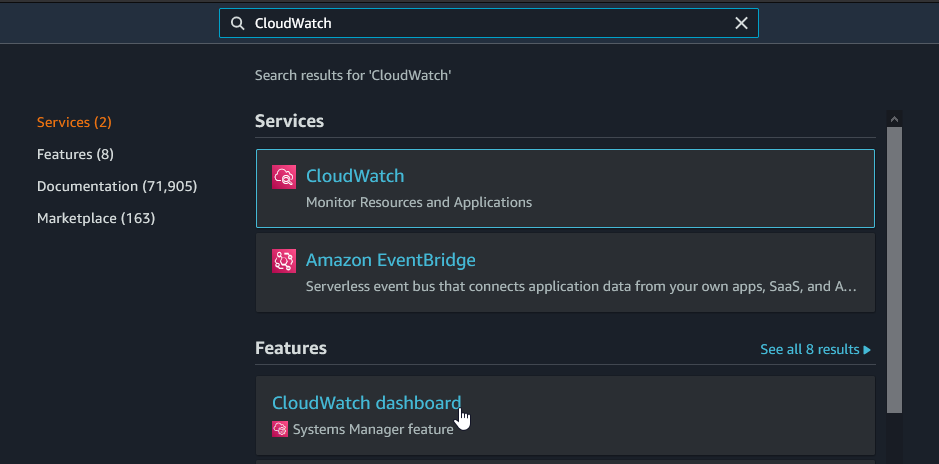
After installing the CloudWatch Mule® Integration, access to all dashboards and monitors becomes available on the CloudWatch page.
DASHBOARDS:
MONITORS:
Before using the dashboards, you must know the identifiers of the organization and environments. This will help to filter out the graphics in the dashboards as well as properly use the tags in the metrics.
MuleSoft has documented this in the following articles:
How to know my Organization ID (Org ID) on the Anypoint Platform
https://help.mulesoft.com/s/article/How-to-know-my-Organization-ID-Org-ID-on-the-Anypoint-Platform
How to get Anypoint platform organization details via Anypoint APIs
https://help.mulesoft.com/s/article/How-to-get-Anypoint-platform-organization-details-via-Anypoint-APIs
It's advisable to save custom views in dashboards requiring these identifiers for optimal visualization.
Find the assets on the CloudWatch Dashboards section:
The Dashboard List should be like this one:
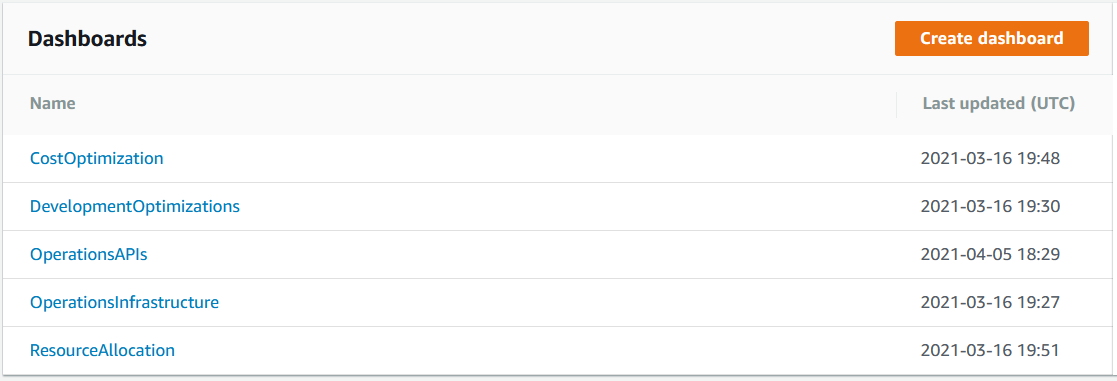
Let’s review how they work.
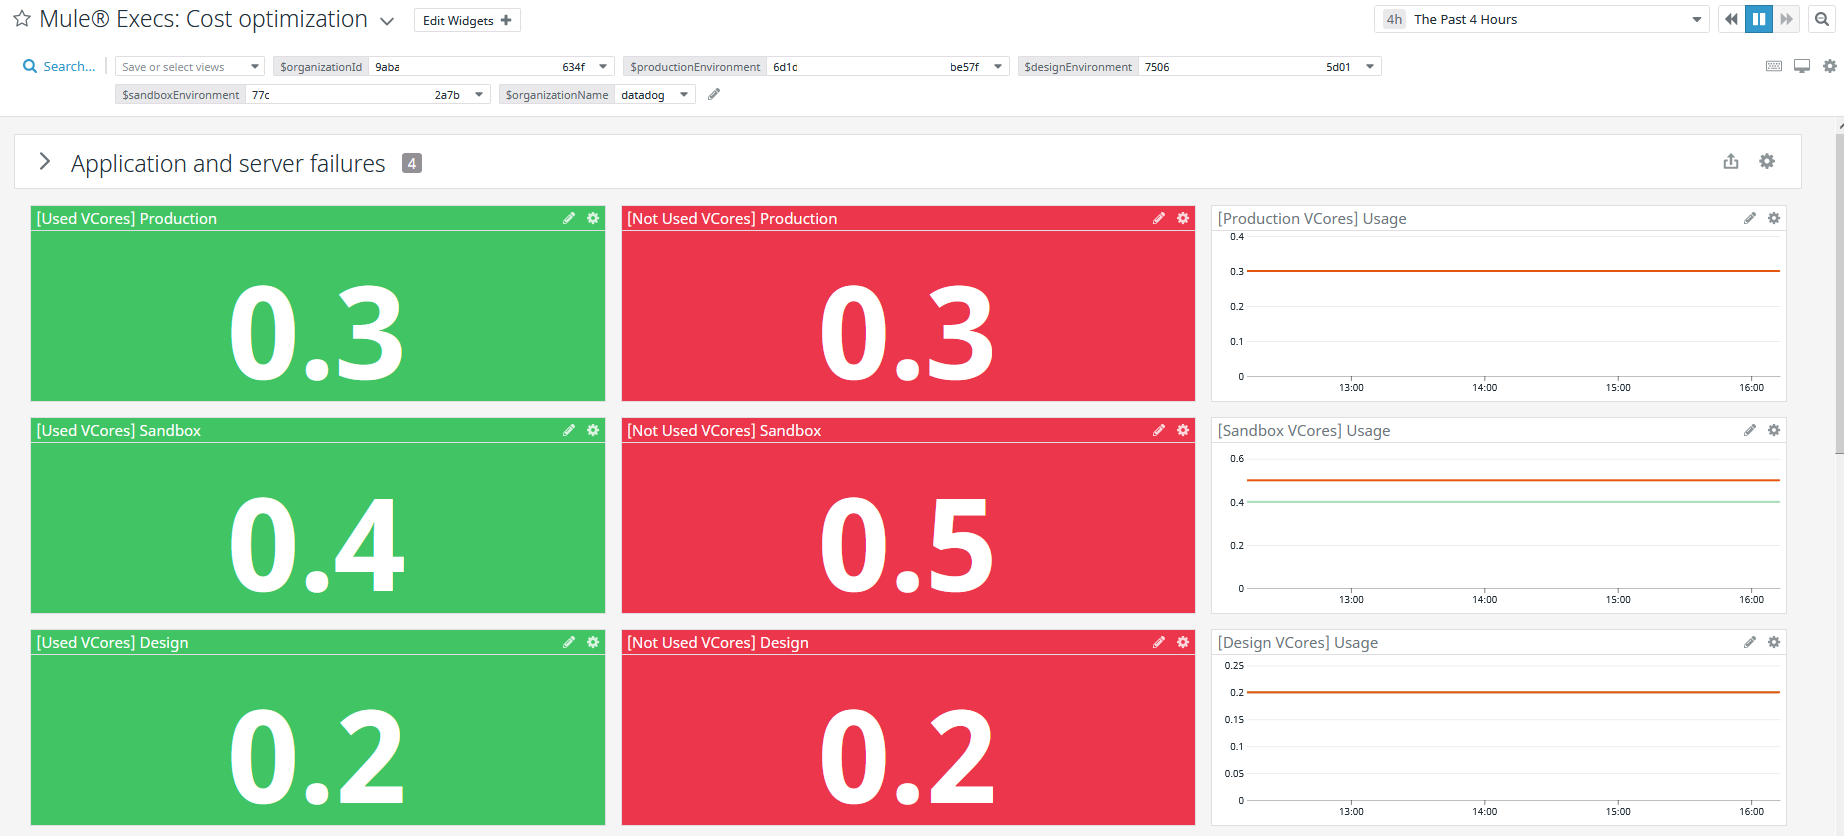
This dashboard monitors the resources available and not available through time per organization, helping you to identify how are being used easily.
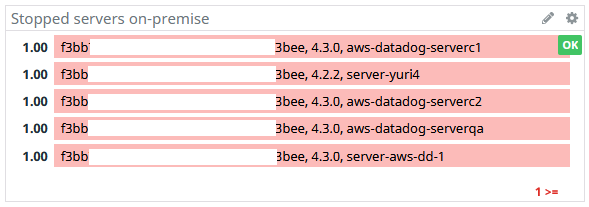
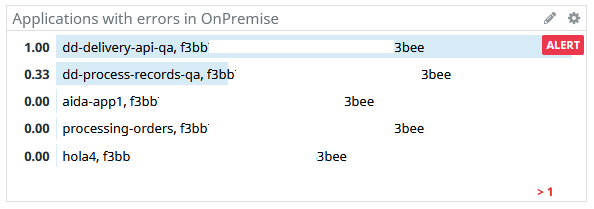
The first section Application and Server failures shows critical and sensitive information about all the infrastructure:
The next section presents the usage of the following resources:
The information is displayed as values with its own timeline graphic, showing the values through time:
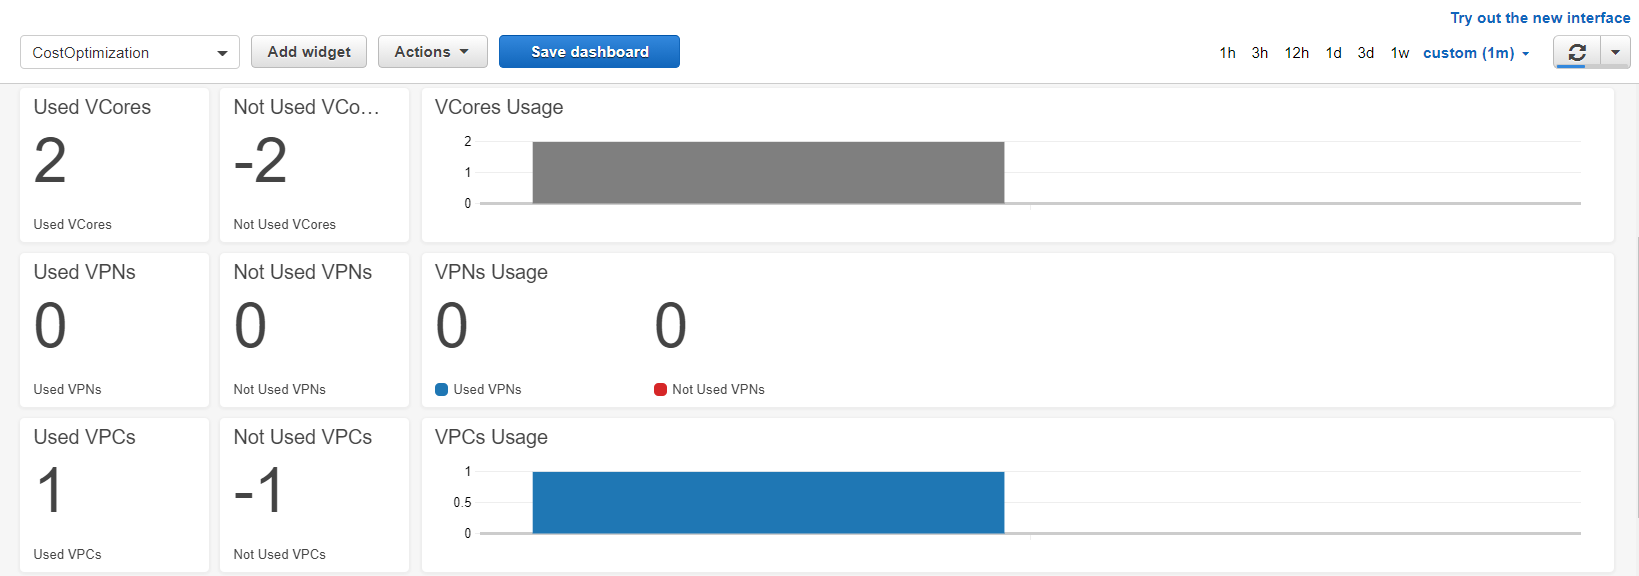
Those widgets work by selecting the time range and the right variables located at the top:
Pro-tip:
Configure the MuleSoft organization and environment identifiers and save the view.
Lorem Ipsum
Lorem Ipsum
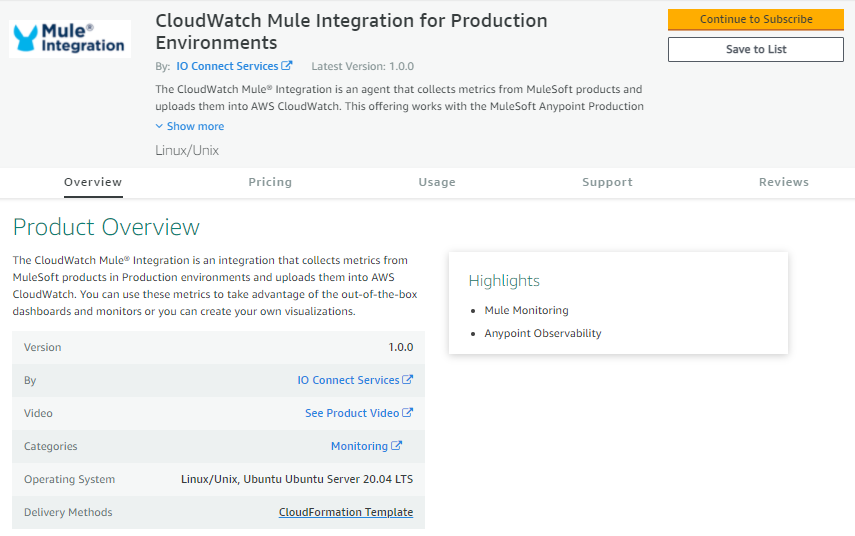
Overview CloudWatch Mule® Integration is an agent-based integration that collects metrics from MuleSoft products and uploads them onto Amazon CloudWatch.
In the CloudWatch Mule® Integration bundle you will find:
You can use these metrics to take advantage of the out-of-the-box dashboards or you can create your own visualizations.
The Mule Runtime Manager agent JMX service allows you to monitor specific JMX metrics and send them to external services. The JMX service collects metrics, which are then sent to publishers responsible for transmitting them to external monitoring tools [1].
Datadog offers a monitoring service with a lightweight Java plugin called JMXFetch. This plugin is invoked by the Datadog Agent, connecting to the MBean Server to collect application metrics. It subsequently sends these metrics to the Datadog Agent using the DogStatsD server, which operates within the Agent[2].
Achieving comprehensive monitoring of your Mule runtimes involves installing the Datadog Mule integration into the agent, enabling Datadog APM, and collecting JVM metrics from your Mule runtime. These metrics provide deep infrastructure insights and link your instances/servers with APM services, providing a unified view of your customer-hosted runtime planes—all within a single platform.
To open JMX metrics consumption at your mule servers for the Datadog agent, you must run your mule runtime or add the below arguments [3] to your mule instance conf folder in a file named wrapper-additional.conf:
·-M-Dcom.sun.management.jmxremote
o To allow the JMX client access to the Mule Java VM.
·-M-Dcom.sun.management.jmxremote.port=portNum
o To enable JVM monitoring of your instance. In the property above, portNum is the port number through which you want to enable JMX RMI connections.
·-M-Dcom.sun.management.jmxremote.local.only=true
o If set to false, remote system monitoring can be configured but if you are running the Datadog agent in the same instance where your mule runtime is running this is not neccessary.
·-M-Dcom.sun.management.jmxremote.authenticate=false
o Password authentication for remote monitoring is enabled by default. To disable it, set the following system property when you start the Mule runtime, moreover all traffic is kept locally and no outbound monitoring is configured.
·-M-Dcom.sun.management.jmxremote.ssl=false
o To use client SSL authentication then set it true, N/A for local monitoring.
·-M-Djava.rmi.server.hostname=host
o To enable JVM monitoring of your instance. In the property above, host is the local IP address of your server to enable JMX RMI connections.
Note: Above properties, like the host and port, will be used later in the Datadog agent configuration.
After running your Mule runtime with the above configuration, the agent can collect these metrics and report them into the Datadog platform, if your Mule runtime was running and you added the properties as a wrapper-additional.conf a restart of your instance is required, let’s configure the agent to do so.
1. A Datadog agent running.
2. Your Mule applications must be customer hosted.
3. The Datadog agent must be able to communicate with the Mule server. Ensure that the configured host and port for the Mule runtime JMX service are reachable.
·Configure the depicted file at the following link according to your needs and specs, please follow Datadog documentation:
o https://docs.datadoghq.com/integrations/java/?tab=host#configuration
·Restart the datadog agent
o Linux:
§ https://docs.datadoghq.com/agent/guide/agent-commands/?tab=agentv6v7#restart-the-agent
o Windows:
§ https://docs.datadoghq.com/agent/basic_agent_usage/windows/?tab=gui
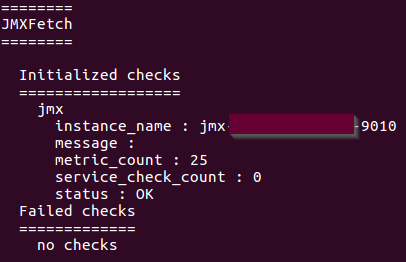
·Let’s check the JMXFetch is running and gathering our instance(s):
o Please follow the below document to verify that JMXFetch check is executing correctly:
§ https://docs.datadoghq.com/agent/troubleshooting/agent_check_status/?tab=agentv6v7
§ When configured and started successfully, it should show you something similar like the below image:
The Datadog Mule® Integration is an agent-based integration. This means that the customer must install the agent in a server on-premises and configure it. https://docs.datadoghq.com/developers/integrations/
.png?VersionId=VzYFExBfAYBkfPTzrP20s1XWvZZhaZTP)
The Datadog Mule® Integration does a license check via SSL and hence it requires outbound access to:
https://api.ioconnectservices.com/
Port: 443
On-prem Mule servers must be registered in Anypoint Runtime Manager (ARM) to be able to collect data. The RM Agent comes in the /bin folder of the Mule runtime, then you can perform the command in CLI. See instructions in https://docs.mulesoft.com/runtime-manager/servers-create.
Any server that’s registered in a group or cluster in ARM must be able to gather metrics from those as well.
In order for the agent to properly connect to ARM in Anypoint, specific network configuration must be allowed. All DNS names, ports and IPs needed to hook the agent are documented in https://docs.mulesoft.com/runtime-manager/rtm-agent-whitelists.
Given the cloud nature of applications deployed to CloudHub, all application and server metadata is intrinsically stored by default on Anypoint Control Plane. No special configuration is required other than the needed permissions in the connected app.
Datadog Mule® Integration includes 5 dashboards and 9 monitors to visualize and identify the usage of your infrastructure resources. The data used in the dashboards and monitors is collected by the metrics.
Once you finalize the Datadog Mule® Integration installation, you will be able to check and use all dashboards and monitors in the Datadog page.
DASHBOARDS
MONITORS
CloudHub and On-Premise.
On-Premise.
CloudHub.
Runtime Fabric
Before using the dashboards, you must know the identifiers of the organization and environments. This will help to filter out the graphics in the dashboards as well as properly use the tags in the metrics.
MuleSoft has documented this in the following articles:
How to know my Organization ID (Org ID) on the Anypoint Platform
https://help.mulesoft.com/s/article/How-to-know-my-Organization-ID-Org-ID-on-the-Anypoint-Platform
How to get Anypoint platform organization details via Anypoint APIs
https://help.mulesoft.com/s/article/How-to-get-Anypoint-platform-organization-details-via-Anypoint-APIs
It’s recommended to save views in the dashboards where these identifiers are needed for proper visualization. Learn more about views here https://docs.datadoghq.com/dashboards/template_variables/#saved-views
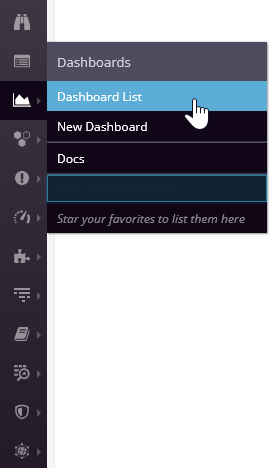
Find the assets in the Datadog web page by clicking at the side bar:
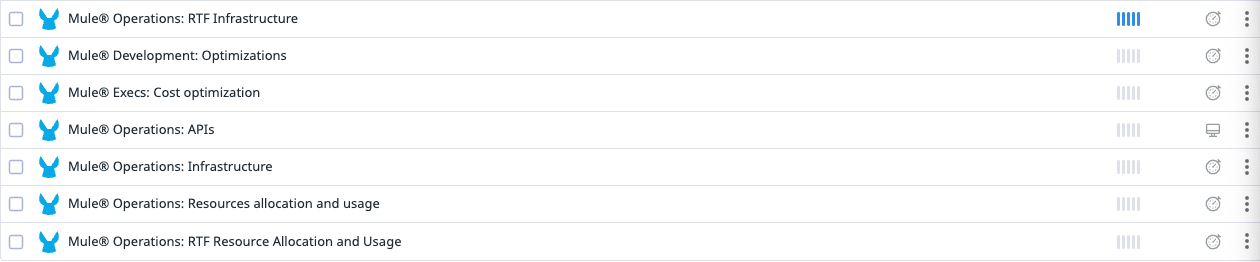
The Dashboard List should be like this one:
Let’s review how they work.
This dashboard monitors the resources available and not available through time per organization, helping you to identify how are being used easily.
The first section Application and Server failures shows critical and sensitive information about all the infrastructure:
The next section presents the usage of the following resources:
The information is displayed as values with its own timeline graphic, showing the values through time:
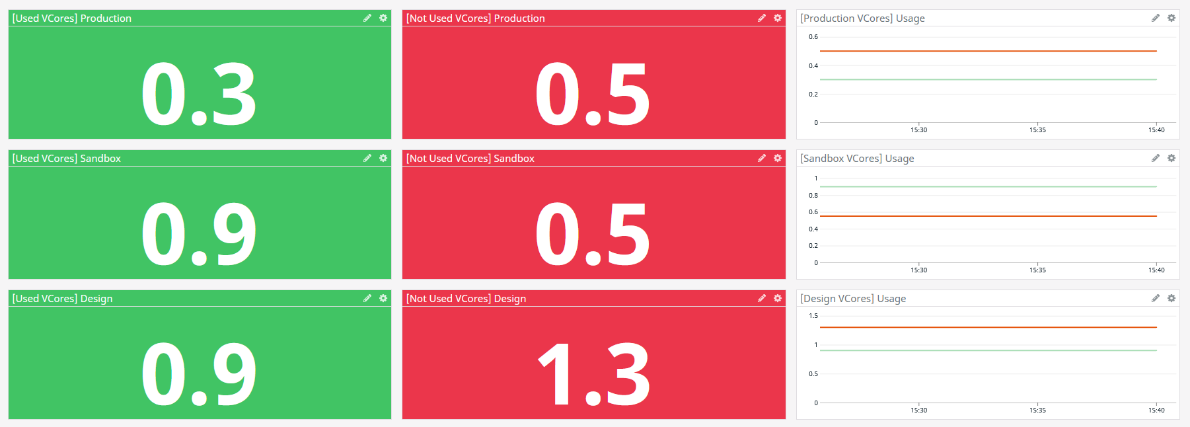
Those widgets work by selecting the time range and the right variables located at the top:

Pro-tip:
Configure the MuleSoft organization and environment identifiers and save the view. See how you can obtain the identifiers and save the view in the Datadog dashboard in the pre-requisites.
By default, the dashboard uses and shows the information of all the organizations and environments (*) in your MuleSoft organization. To bring the information of a specific organization and environment, change the values with the correct Ids and change the time range as needed:
Operations: Infrastructure
The dashboard is divided in three sections:
SECTION 1. CRITICAL:
Contains alerts that monitor applications critical behavior:
These widgets are connected to the monitors, they show when the monitors are in Alert, OK or No Data status:
SECTION 2. CLOUDHUB
SECTION 3. ON-PREMISE
It works similar to the dashboard mentioned before, you must select the variables values and time range as needed:

The Datadog Mule® Integration is a Datadog custom integration and it is configured through a conf.yaml file located at:
The configuration in the conf.yaml is divided into two parts:
This section contains the common configuration used by all the instance executions. It contains the following configurations (these should not be removed):
OBJECT_STORE_V2: Object Store V2 server host url. See https://docs.mulesoft.com/object-store/osv2-apis for the full list of available hosts. This host definition is used by the Object Store API. Example value: https://object-store-us-east-1.anypoint.mulesoft.com
OBJECT_STORE_V2_STATS: The Object Store V2 Stats server host url. This host definition is used by the Object Store V2 Stats API . It is preconfigured with https://object-store-stats.aypoint.mulesoft.com
MULE_SERVER: This is the URL or IP address of the server where a Mule Runtime with the Mule Agent is running. The MULE_SERVER host definition is utilized by the ARM APIs. For example, the value might be http://localhost:9999.
OAUTH_PROVIDER: This is the OAuth Provider URL responsible for obtaining a Bearer token used for making requests to all the APIs. By default, it is preconfigured with https://anypoint.mulesoft.com/accounts/api/v2/oauth2/token. However, please note that it might differ for EU or GOV Mule Regions. For specific configurations in these regions, refer to the documentation at link to documentation. see https://docs.mulesoft.com/access-management/managing-users#prerequisites
The Client ID for the authentication API. This value is obtained by creating a connected app in Anypoint Platform.
The Client Secret for the authentication API. This value is obtained by creating a connected app in Anypoint Platform.
The Environment ID represents the specific environment (such as Development, Staging, or Production).
The Organization ID for the requests that requires to specify it.
The Customer key is provided from our team once the purchase is completed.
The number of seconds that authentication method will wait until next retry. If not specified it is defaulted to 2
The number of retry attempts that authentication method will perform. If not specified it is defaulted to 3
In the Full Example section there is an example of a configuration file with all the values configured.
This section contains a list of instances defined following the YAML list item notation -. Each instance is scheduled independently to run a set of APIs with a specific threads number configuration. Each instance contains the following configurations:
In the Full Example Section there is an example of a configuration file with a list of instances. The example is taken directly from the conf.yaml file distributed with the integration and contains the optimum numbers we recommend for almost any scenario for min_collection_interval and threads.
The metric collection of any instance can be disabled at any time by commenting out the whole instance. This means, commenting the two attributes mentioned above.
The example file provided in datadog_checks/iocs_dmi/data/conf.yaml.example and copied to the conf.d/iocs_dmi.d/conf.yaml.example folder after the installation process contains a configuration with all the possible values already configured and they should just work for the common usage case.
instances section contains a list of instances that were set to a periodicity and concurrency level according to each API provided information. Even if all these values can be changed, we recommend just go with the defaults.
The main configuration parameters to pay attention are:
In the section, it depends on the CloudHub Region and can be found at the following link https://docs.mulesoft.com/object-store/osv2-apis
In the hosts section, it depends on the Mule Agent configuration. Following the defaults of the Mule Agent configuration it would be http://localhost:9999 to retrieve the metrics from a Mule Runtime running on the same machine
The credentials to get access to the Anypoint platform. More information about Connected Apps:https://docs.mulesoft.com/access-management/connected-apps-overview. The two parameters to configure:
Connected Apps account client_id
It must be configured with the Connected Apps account client_secret
The Environment ID for environment specific requests. See https://docs.mulesoft.com/access-management/environments and https://help.mulesoft.com/s/question/0D52T00004mXPvSSAW/how-to-find-cloud-hub-environment-id
The Organization ID for the requests that requires to specify it. See https://docs.mulesoft.com/access-management/organization and https://help.mulesoft.com/s/article/How-to-know-my-Organization-ID-Org-ID-on-the-Anypoint-Platform
The API key provided by IO Connect Services when you purchased the product
The Customer key provided by IO Connect Services when you purchased the product
For EU or GOV Mule Regions, the anypoint and oauth_provider should be changed too. See https://docs.mulesoft.com/access-management/managing-users#prerequisites