DATADOG MULE® INTEGRATION
JMX [On-Prem] | Visualizing
Visualizing the JMX metrics
Now, let's confirm you are able to see the metrics in Datadog web page. Login into: https://app.datadoghq.com/account/login?next=%2F
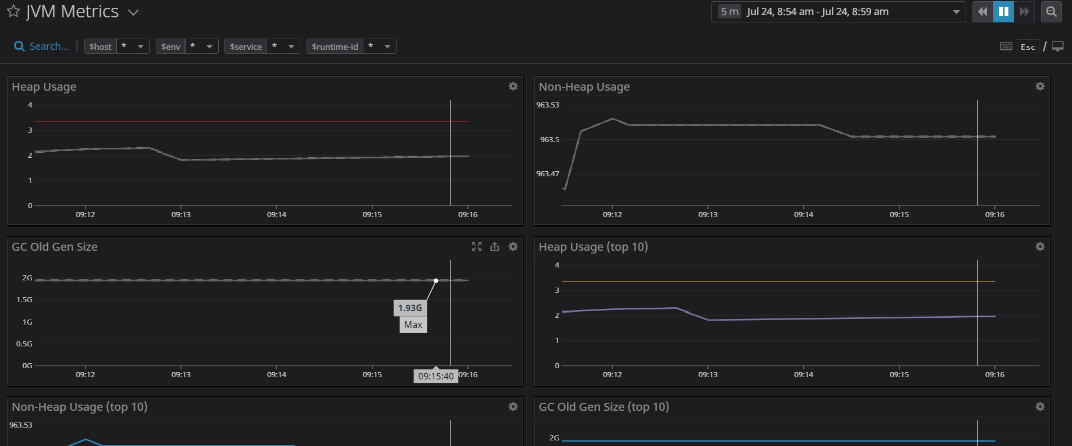
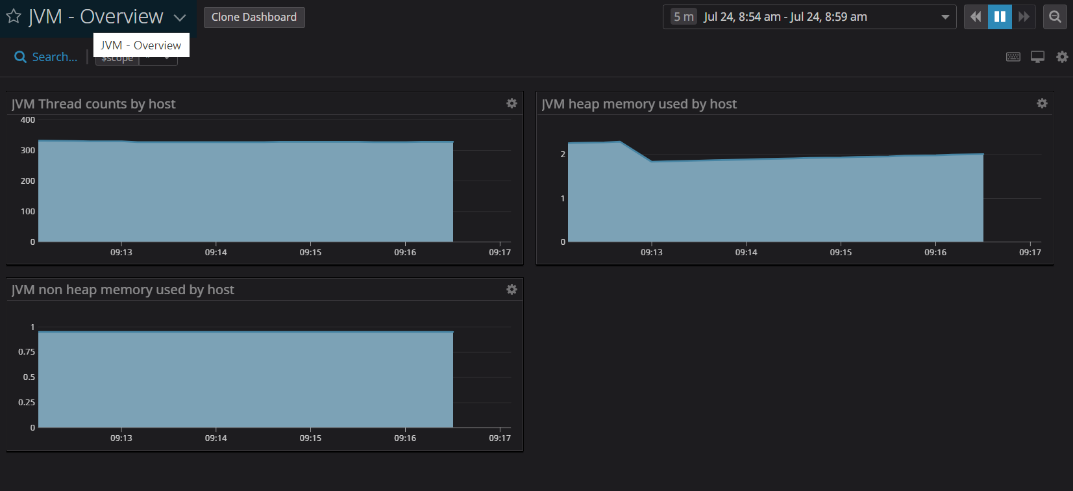
·Once there, go to the left menu, select Dashboards and there, look for JVM Metrics or JVM - Overview dashboard.
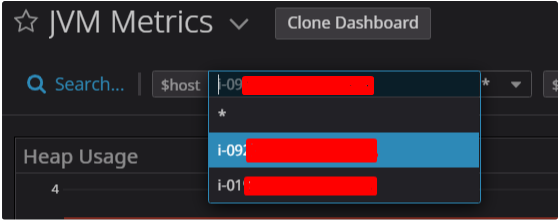
o If the JVM Metrics dashboard is selected, then go up into the dashboard, below the dashboard name, and check for the $host variable, here select your host or “*” to show hosts gathered metrics.
o If the JVM - Overview dashboard is selected, then go up into the dashboard, below the dashboard name, and check for the $scope variable, here select your host or “*” to show hosts gathered metrics.
o Please find below an image of what it is depicted above:

·And that’s it you can visualize your JMX metrics OOB.


This link contains the list of the metrics you can obtain from JMX.
References
[1] https://docs.mulesoft.com/runtime-manager/jmx-service
[2] https://docs.datadoghq.com/integrations/java/?tab=host#metric-collection
[3] https://docs.oracle.com/javase/8/docs/technotes/guides/management/agent.html