DATADOG MULE® INTEGRATION
JMX [On-Prem]
The Mule Runtime Manager agent JMX service allows you to monitor specific JMX metrics and send them to external services. The JMX service collects metrics, which are then sent to publishers responsible for transmitting them to external monitoring tools [1].
Datadog offers a monitoring service with a lightweight Java plugin called JMXFetch. This plugin is invoked by the Datadog Agent, connecting to the MBean Server to collect application metrics. It subsequently sends these metrics to the Datadog Agent using the DogStatsD server, which operates within the Agent[2].
Achieving comprehensive monitoring of your Mule runtimes involves installing the Datadog Mule integration into the agent, enabling Datadog APM, and collecting JVM metrics from your Mule runtime. These metrics provide deep infrastructure insights and link your instances/servers with APM services, providing a unified view of your customer-hosted runtime planes—all within a single platform.
JMX metrics at mule runtimes
To open JMX metrics consumption at your mule servers for the Datadog agent, you must run your mule runtime or add the below arguments [3] to your mule instance conf folder in a file named wrapper-additional.conf:
·-M-Dcom.sun.management.jmxremote
o To allow the JMX client access to the Mule Java VM.
·-M-Dcom.sun.management.jmxremote.port=portNum
o To enable JVM monitoring of your instance. In the property above, portNum is the port number through which you want to enable JMX RMI connections.
·-M-Dcom.sun.management.jmxremote.local.only=true
o If set to false, remote system monitoring can be configured but if you are running the Datadog agent in the same instance where your mule runtime is running this is not neccessary.
·-M-Dcom.sun.management.jmxremote.authenticate=false
o Password authentication for remote monitoring is enabled by default. To disable it, set the following system property when you start the Mule runtime, moreover all traffic is kept locally and no outbound monitoring is configured.
·-M-Dcom.sun.management.jmxremote.ssl=false
o To use client SSL authentication then set it true, N/A for local monitoring.
·-M-Djava.rmi.server.hostname=host
o To enable JVM monitoring of your instance. In the property above, host is the local IP address of your server to enable JMX RMI connections.
Note: Above properties, like the host and port, will be used later in the Datadog agent configuration.
After running your Mule runtime with the above configuration, the agent can collect these metrics and report them into the Datadog platform, if your Mule runtime was running and you added the properties as a wrapper-additional.conf a restart of your instance is required, let’s configure the agent to do so.
Setting up the Datadog Agent for JMX fetch
Prerequisites
1. A Datadog agent running.
2. Your Mule applications must be customer hosted.
3. The Datadog agent must be able to communicate with the Mule server. Ensure that the configured host and port for the Mule runtime JMX service are reachable.
Configuration/Steps
·Configure the depicted file at the following link according to your needs and specs, please follow Datadog documentation:
o https://docs.datadoghq.com/integrations/java/?tab=host#configuration
·Restart the datadog agent
o Linux:
§ https://docs.datadoghq.com/agent/guide/agent-commands/?tab=agentv6v7#restart-the-agent
o Windows:
§ https://docs.datadoghq.com/agent/basic_agent_usage/windows/?tab=gui
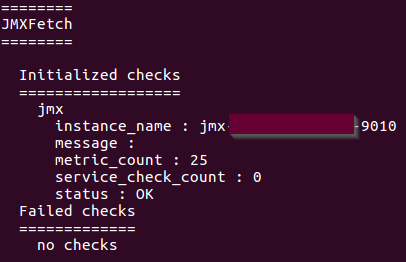
·Let’s check the JMXFetch is running and gathering our instance(s):
o Please follow the below document to verify that JMXFetch check is executing correctly:
§ https://docs.datadoghq.com/agent/troubleshooting/agent_check_status/?tab=agentv6v7
§ When configured and started successfully, it should show you something similar like the below image: