CLOUDWATCH MULE® INTEGRATION
OOTB Assets
CloudWatch Mule® Integration offers seven dashboards and thirteen monitors for comprehensive visualization and management of your infrastructure resources. Metrics collected serve as the basis for the insights provided by these tools.
After installing the CloudWatch Mule® Integration, access to all dashboards and monitors becomes available on the CloudWatch page.
DASHBOARDS:
- Development: Optimizations.
- Execs: Cost optimization.
- Operations: APIs
- Operations: Infrastructure.
- Operations: Resources allocation and usage.
MONITORS:
- CloudHub and On-Premise.
- Applications stopped.
- CPU Load.
- Memory usage.
- On-Premise.
- Servers stopped.
- Application errors.
- CloudHub.
- Queue overload.
- Queue overload.
Prerequisites
Before using the dashboards, you must know the identifiers of the organization and environments. This will help to filter out the graphics in the dashboards as well as properly use the tags in the metrics.
MuleSoft has documented this in the following articles:
How to know my Organization ID (Org ID) on the Anypoint Platform
https://help.mulesoft.com/s/article/How-to-know-my-Organization-ID-Org-ID-on-the-Anypoint-Platform
How to get Anypoint platform organization details via Anypoint APIs
https://help.mulesoft.com/s/article/How-to-get-Anypoint-platform-organization-details-via-Anypoint-APIs
It's advisable to save custom views in dashboards requiring these identifiers for optimal visualization.
Dashboards
Find the assets on the CloudWatch Dashboards section:
The Dashboard List should be like this one:
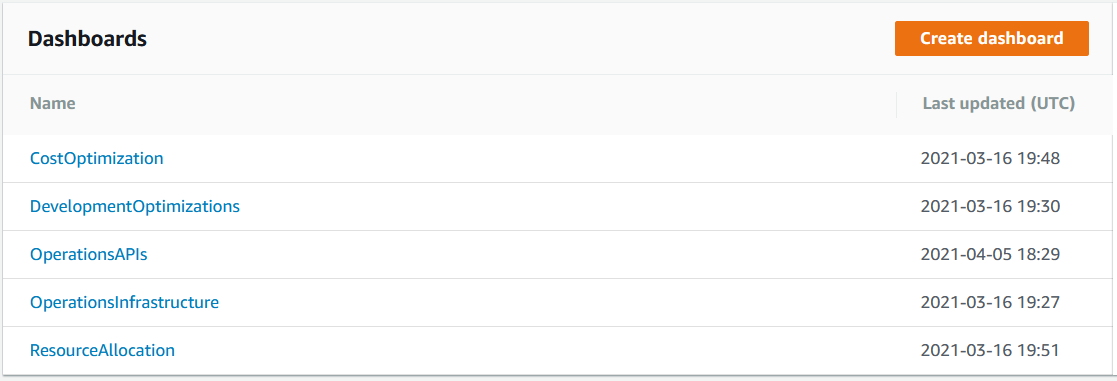
Let’s review how they work.
Execs: Cost Optimization
This dashboard monitors the resources available and not available through time per organization, helping you to identify how are being used easily.
The first section Application and Server failures shows critical and sensitive information about all the infrastructure:
- Applications stopped time.
- Applications stopped TOP 10 list.
- Applications error On-Premise.
- Applications errors On-Premise TOP 10 list.
The next section presents the usage of the following resources:
- vCores.
- VPNs.
- VPCs.
- Static IPs.
- Load Balancers.
- Premium Connectors.
- Object Store.
The information is displayed as values with its own timeline graphic, showing the values through time:
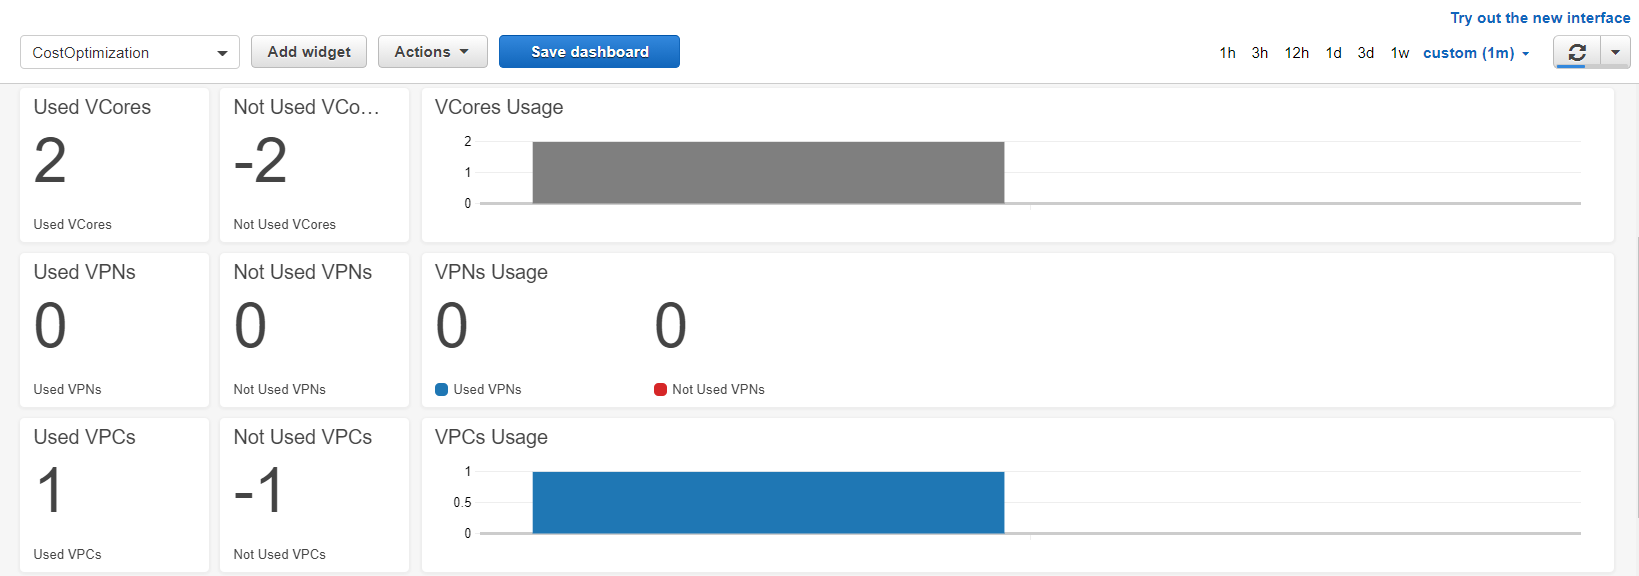
Those widgets work by selecting the time range and the right variables located at the top:
Pro-tip:
Configure the MuleSoft organization and environment identifiers and save the view.