Datadog Mule Integration 4 APM
Step by Step Tracing
Step by step tracing
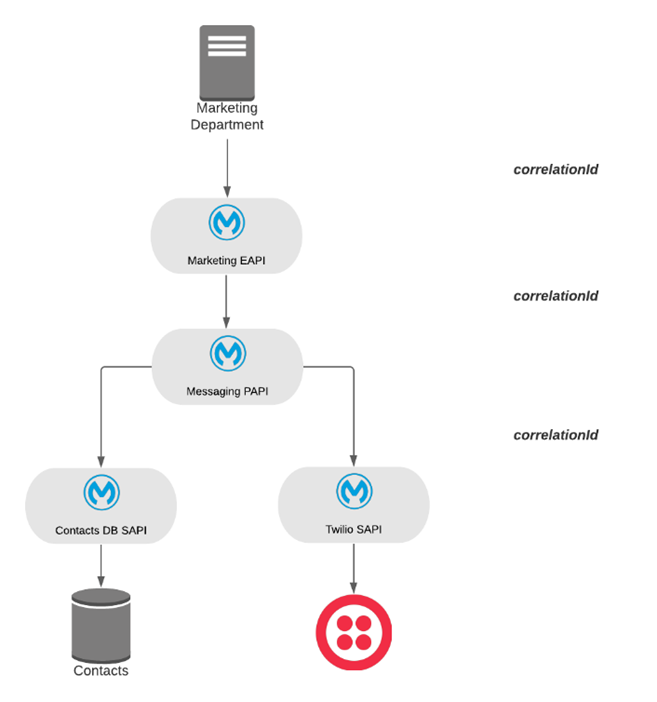
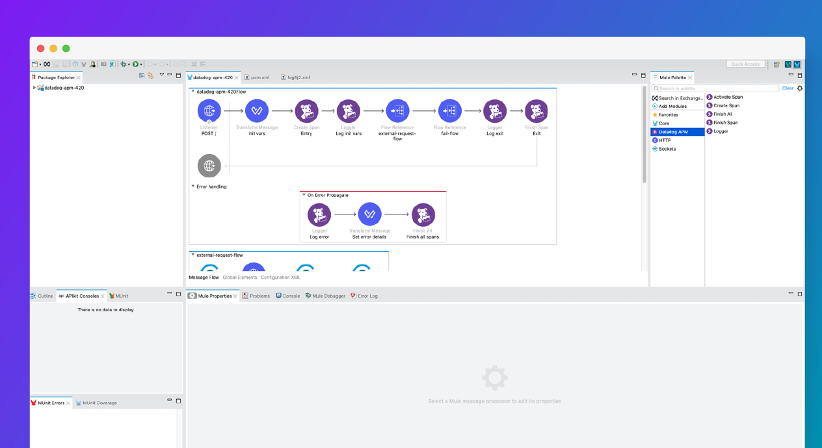
The Marketing APIs are an API-led solution to send an SMS by retrieving the contact number from a database and sending the SMS via Twilio. Every event is tracked in Datadog with the correlationId which is shared across all applications.
Sections:
Prerequisites:
- Mule 4.1.1 and above
- Datadog APM Connector as an asset in your company's Anypoint Platform Exchange (for access contact IO Connect Services)
- Anypoint Studio 7
Goals
These example APIs have 2 goals:
-
To showcase a marketing API that sends SMS to users by fetching contact details from a database, utilizing mock calls for demonstration.
-
To illustrate Datadog's capability in tracking API events with a correlation ID, ensuring traceability across all operations.
Results
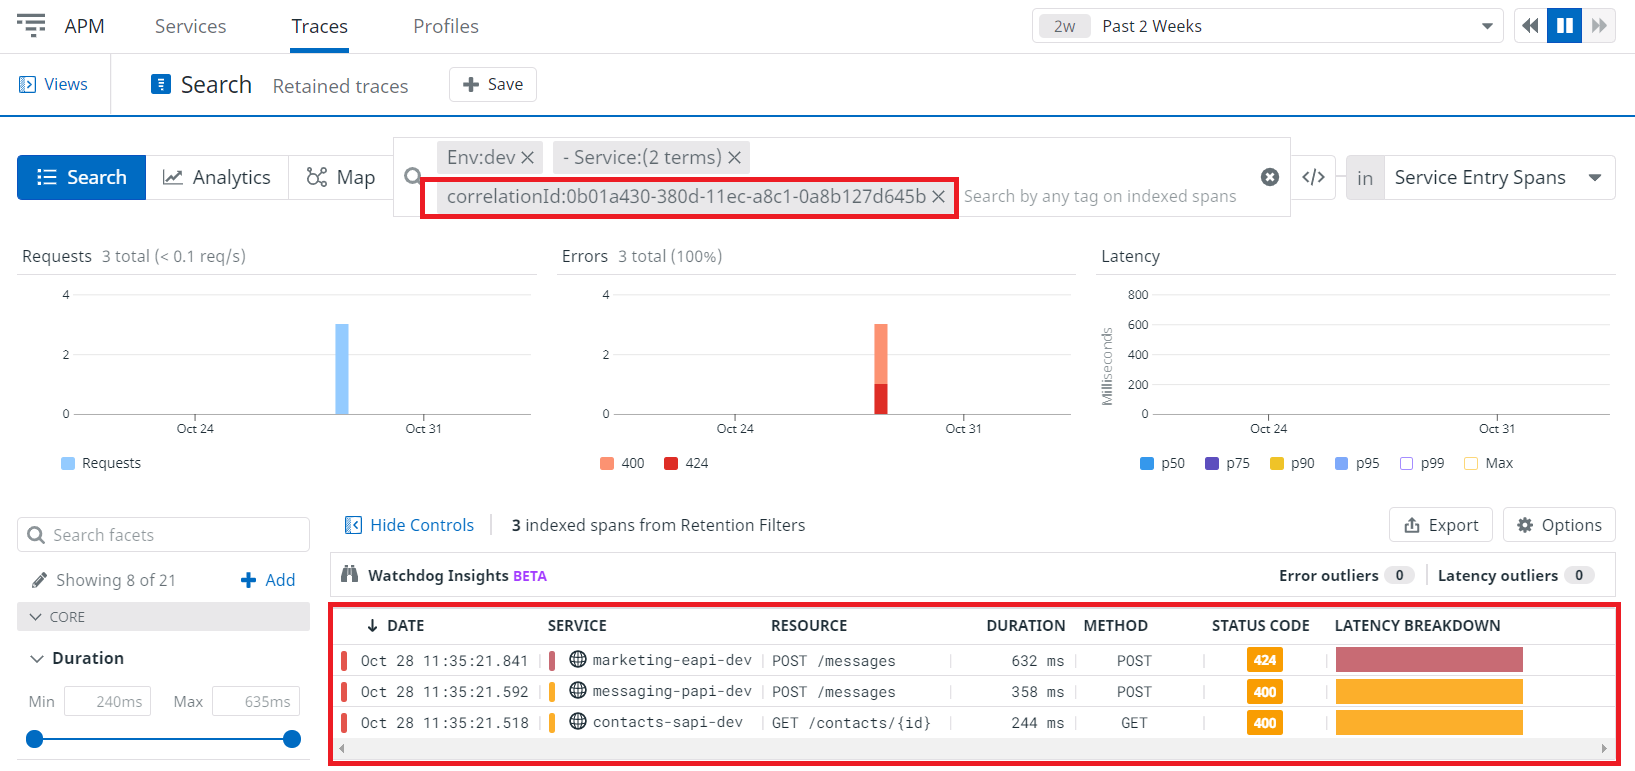
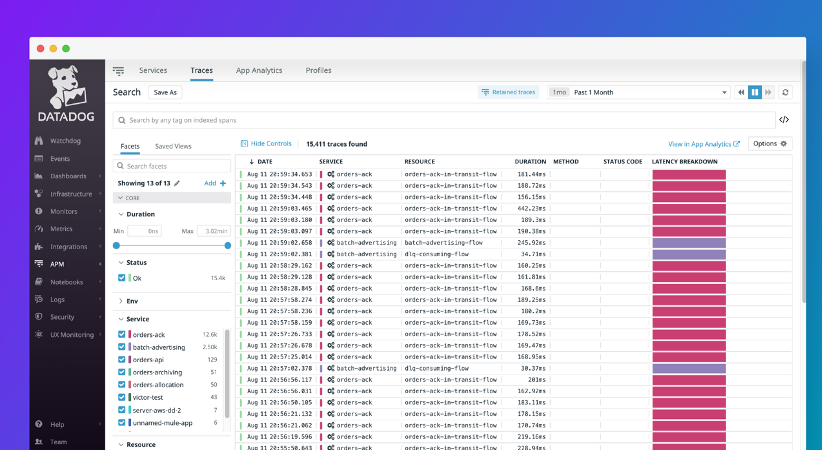
Following the setup and execution guidelines will display API activities on Datadog's APM Traces page, including error scenarios identified by correlation IDs.
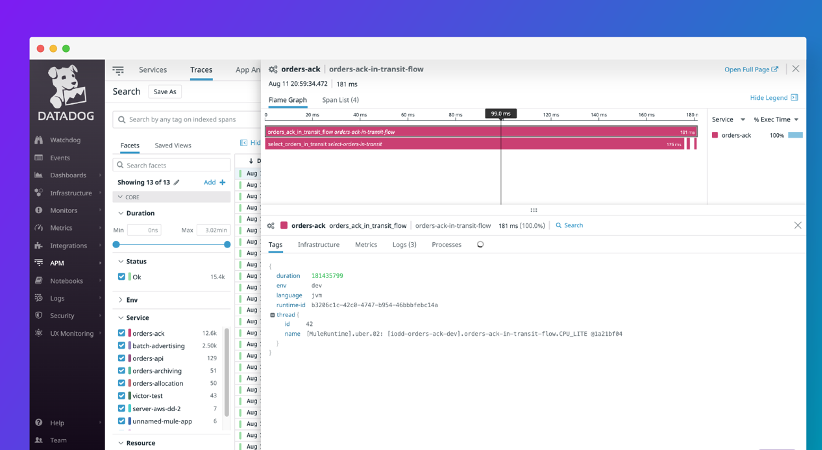
Please find in the below image, traces for an error scenario tracked by a correlation ID.
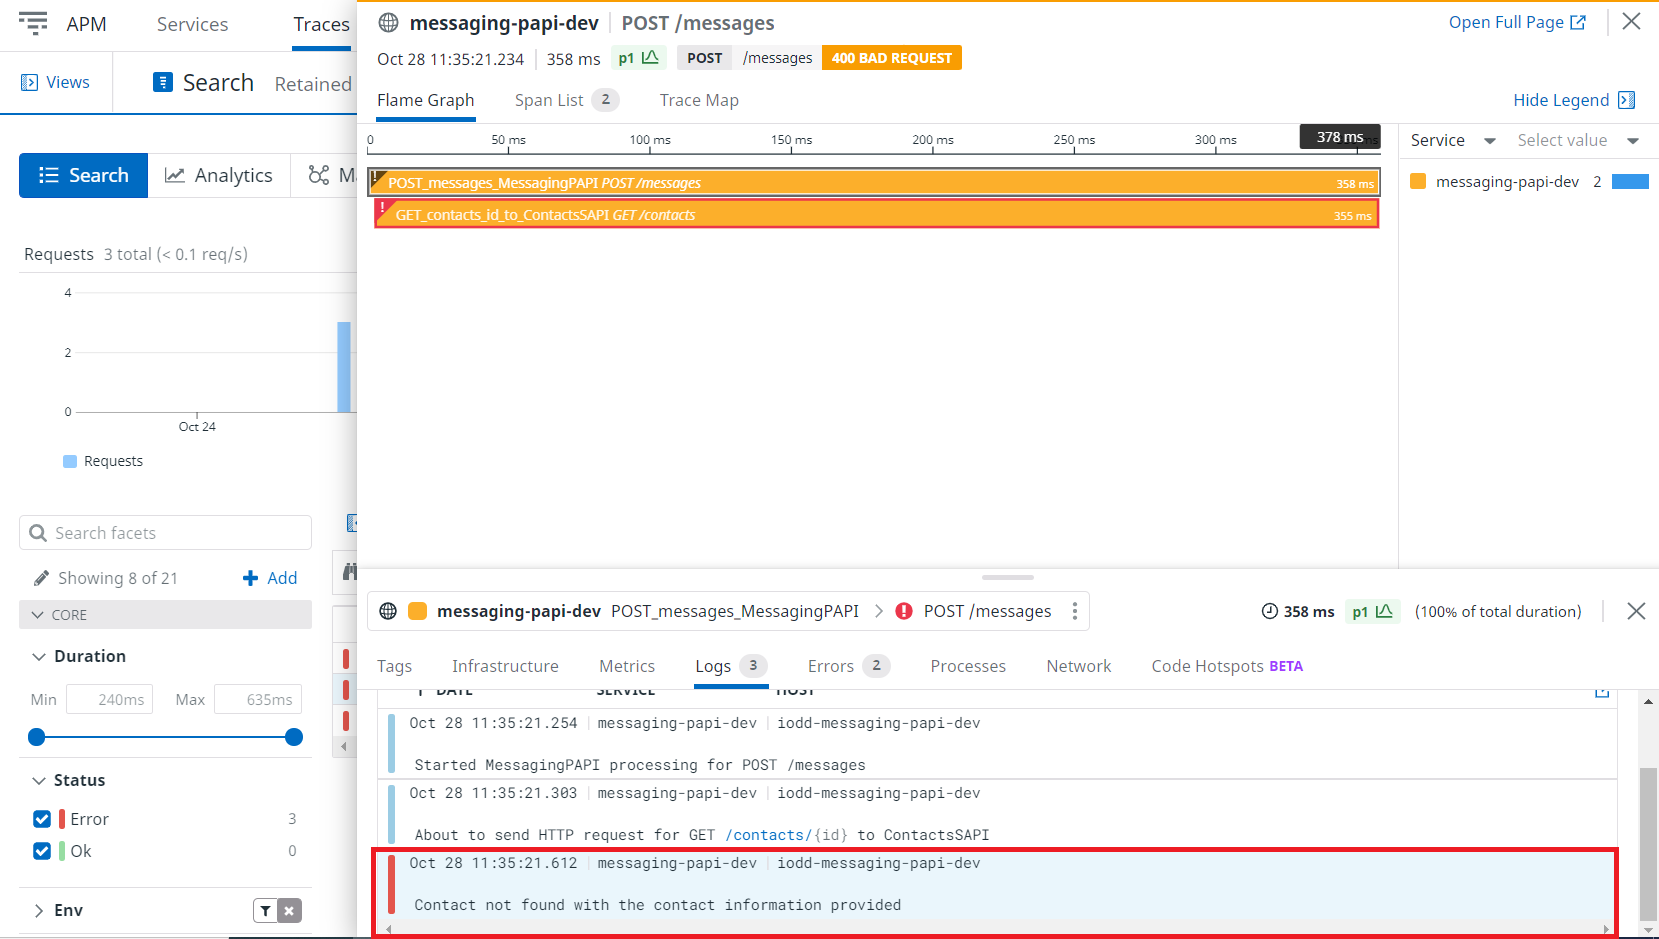
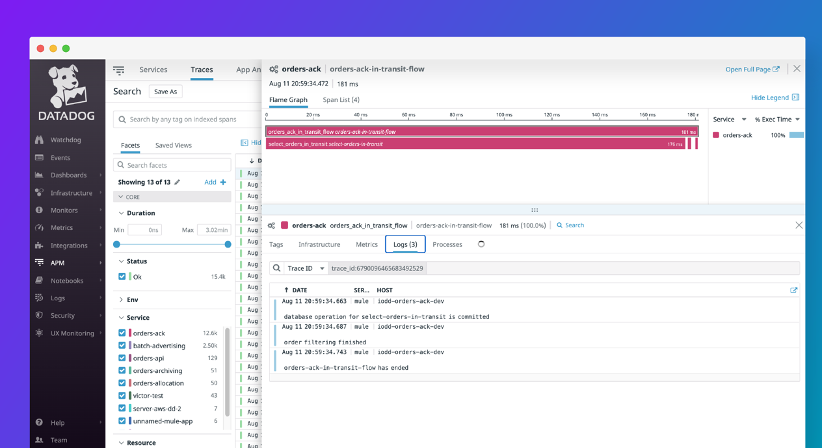
Each event in the Mule flow produces log entries that are correlated to the span in the APM trace. Below, you can see that an error log is associated with a failed span.
Datadog Mule Integration 4 APM
Logging
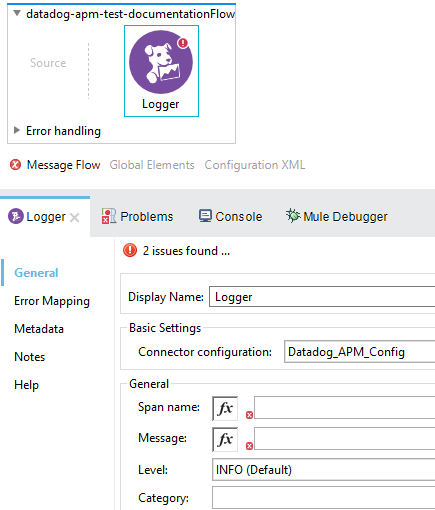
The Logger operation in the Datadog APM Connector for Mule 4 applications, is a log4j-complaint logger. This will follow the same lifecycle as the regular Mule Logger operation.
https://docs.mulesoft.com/mule-runtime/4.3/logger-component-reference
The Logger operation logs a given message into the corresponding Span. Logs linked to the span will be visible by clicking on the Traces tab inside the Span in the Datadog APM.
The Logger operation supports the following configurations.
-
Display name: By default is displayed as Logger.
-
Connector Configuration: Required.
-
Span name: Span in which the information will be logged, required.
-
Message: The message this log has, required.
-
Logging Level: logged to the span. default is INFO.
-
Category: An extra field to indicate the Category of the log. optional.
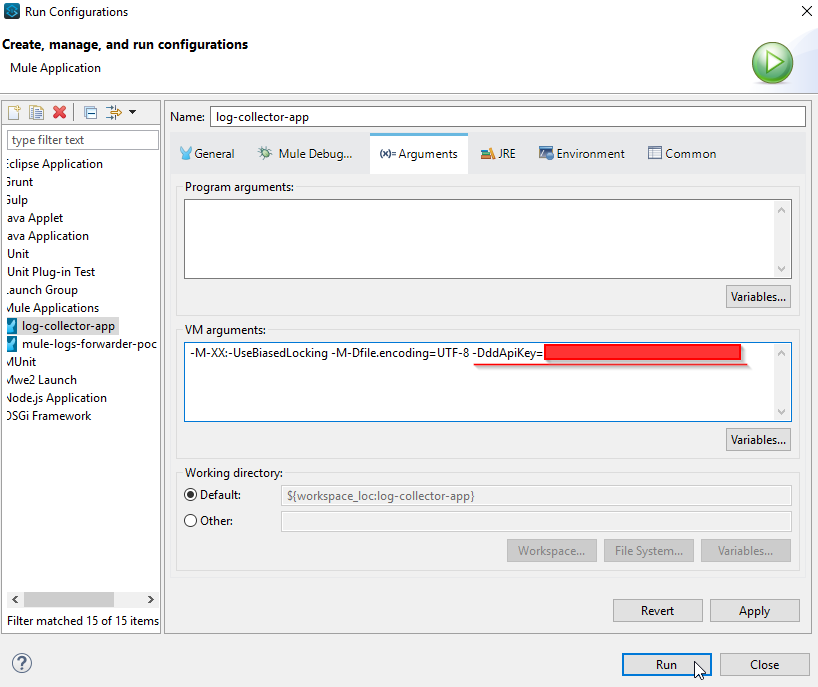
To use this operation, you need to configure the appended in the log4j2.xml file in your project as the below example. This will help to forward the logs captured in Log4J2 to the Datadog Log platform. Note that there's a system variable, ddApiKey, that is passed at runtime.
<Http name="DD-HTTP" url="https://http-intake.logs.datadoghq.com/v1/input" verifyHostname="false" method="POST">
    <Property name="DD-API-KEY" value="${sys:ddApiKey}" />
    <JSONLayout compact="false" eventEol="true" properties="true" stacktraceAsString="true">
        <KeyValuePair key="host" value="${sys:domain}" />
        <KeyValuePair key="appName" value="${sys:domain}" />
        <KeyValuePair key="ddsource" value="mule" />
        <KeyValuePair key="service" value="mule" />
        <KeyValuePair key="correlationId" value="$${ctx:correlationId:-}"/>
    </JSONLayout>
</Http>
In Studio, you can configure this variable as a VM argument.
Datadog Mule Integration 4 APM
XML Reference
Datadog Config
The Datadog APM Global Configuration organizes connection elements such as the host and port, also provides configuration parameters for optional config like the Service Name and the Environment.
<datadog-apm:config name="Datadog_APM_Config" >
    <datadog-apm:connection host="${host}" port="8126" environment="${env}" service="${service}"/>
</datadog-apm:config>
<datadog-apm:config name="Datadog_APM_Config" >
    <datadog-apm:connection host="${host}" port="8126" environment="${env}" service="${service}"/>
</datadog-apm:config>
Parameters
|
Name |
Type |
Description |
Default Value |
Required |
|---|---|---|---|---|
|
host |
String |
Host where the Datadog Instance is running |
|
x |
|
port |
int |
Port to connect to the Datadog instance |
|
x |
|
service |
String |
Service name to reference this execution |
unnamed-java-app |
|
|
environment |
String |
label to states the environment where the execution is running |
|
|
Operations
Create Span
The Create Span element sets a Span with a name, this span will run as soon as is created in the flow, can have a parent and fields for tags.
<flow name="datadog-connectorFlow" >
    <datadog-apm:create-span config-ref="Datadog_APM_Config" spanName="Span" parent="Parent of this span" method="GET" path="/services/traces" autofinish="false">
        <datadog-apm:tags >
            <datadog-apm:tag key="key" value="value" />
        </datadog-apm:tags>
    </datadog-apm:create-span>
</flow>
Parameters
|
Name |
Type |
Description |
Default Value |
Required |
|---|---|---|---|---|
|
config-ref |
Configuration |
Global configuration element of the operation |
|
x |
|
spanName |
String |
Name of the span to be created |
|
x |
|
parent |
String |
Name of a span that will act as the parent of the one created in this operation |
|
|
|
method |
String |
HTTP Method to be inserted in the span |
|
|
|
path |
String |
Path to be inserted in the span |
|
|
|
tags |
Map |
Key-value pair of tags that can be inserted in the span |
|
|
|
autofinish |
Checkbox |
Indicates if span will be auto finish at the end of the flow |
false |
|
Finish Span
The Finish Span element finishes a span already created in the flow, sending this span to the Datadog APM view with its respective timestamps, contains the global configuration and the span name to be finished.
<flow name="datadog-connectorFlow" >
    <datadog-apm:finish-span config-ref="Datadog_APM_Config" spanName="Span to be finished" error="false" statusCode="200"/>
</flow>
Parameters
|
Name |
Type |
Description |
Default Value |
Required |
|---|---|---|---|---|
|
config-ref |
Configuration |
Global configuration element of te operation |
|
x |
|
spanName |
String |
Name of the span to be finished |
|
x |
|
error |
Boolean |
Check if the span is marked as error |
false |
|
|
statusCode |
Integer |
Set the status code of a span if stated |
|
|
Datadog Mule Integration 4 APM
Configuration and Operations
This document explains what the Datadog APM Connector is, how to configure it and how to make use of it.
Software required:
-
Java JDK 8.
-
Anypoint Studio 7 or greater.
-
Apache Maven 3.3.9 or greater.
Using the Connector
The Connector has 6 operations:
-
Create Span
-
Finish Span
-
Update Span
-
Activate Span
-
Finish All
-
Logger
Additionally, it has a Global Configuration called Datadog APM Config.
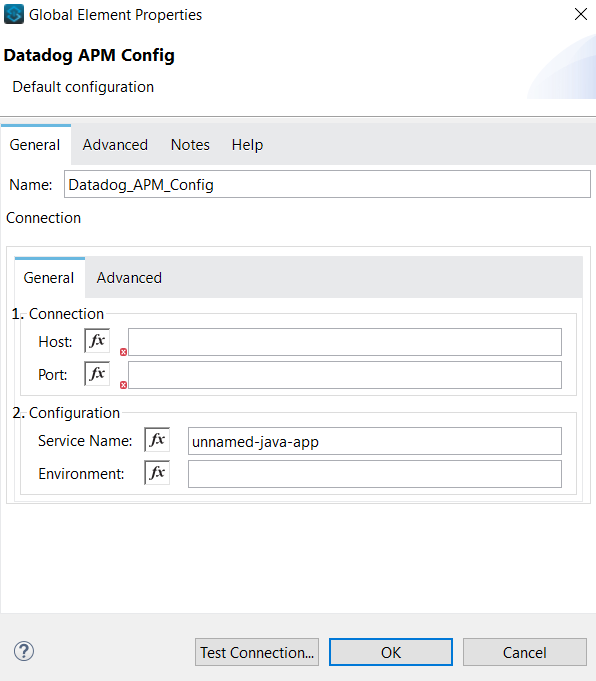
Datadog APM Config
The Datadog APM Config is the global configuration of the Connector. It establishes the connection between the Mule application and the Datadog agent running APM.
-
These are the connection settings, here you set the host where the Datadog Agent is running, and the port, by default the traces are sent via port 8126.
-
These are optional information to give more context about the connection, by default the service name is unnamed-java-app, even if this field is empty.
Datadog Mule Integration 4 APM
Dashboards
The Datadog APM Connector seamlessly integrates with Mule 4 applications, offering comprehensive instrumentation capabilities for both CloudHub-hosted and on-premises deployments. This tool enables detailed performance monitoring of events within Mule flows, providing essential insights for optimization. For an in-depth exploration of Datadog APM's features, including traces and spans, please visit our documentation here.
Leverage the Datadog Connector to enrich your Mule 4 applications with advanced APM tracing. This integration facilitates unparalleled visibility into application performance, courtesy of Datadog’s intuitive performance dashboards.
Unlock detailed metrics on your flow operations with precise granularity, utilizing spans to dissect performance at every level.
Achieve a granular perspective on each span within your traces, enhancing diagnostic capabilities and streamlining performance optimization efforts.
Effortlessly correlate transaction logs to their respective traces, simplifying the troubleshooting process and improving overall visibility into application performance.
DATADOG MULE® INTEGRATION
Customization
The instances property in the conf.yaml file allows you to customize how the agent collects metrics. This means you can manually distribute the API requests performed by the agent, balancing the load across different instances and collecting data based on your specific requirements.
Let's assume you are interested in getting updated data of your CloudHub and On-Prem apps behavior, through the Development: Optimizations dashboards, you'd like to monitor the CPU, memory and networking in a constant rate, but you won't like to push the agent to get at the same rate the metrics of your resource allocation. You can easily set up the following configuration to fulfill the depicted requirement.
instances:
   - min_collection_interval: 172800
      threads: 32
      api_filter:
         - access_management
   - min_collection_interval: 10
      threads: 32
      api_filter:
         - cloudhub
In this example, you are running two separate executions of our metric reader program. If you find yourself in a scenario where customizing API calls is necessary, you can refer to the configuration section to locate the configuration YAML file and adjust your settings accordingly. After making the changes, simply restart the agent to apply the new configuration, and you will have a customized agent ready to meet your specific needs.
CLOUDWATCH MULE® INTEGRATION
Customization
The instances property in conf.yml enables customization of metric collection by the agent, allowing for manual load balancing across different instances. This feature lets you tailor data gathering for CloudHub and On-Prem apps, focusing on specific metrics like CPU, memory, and networking at desired rates without overloading the agent.
For example, to monitor these metrics through the "Development: Optimizations" dashboards without taxing the agent on resource allocation metrics, you can adjust the configuration accordingly to meet your monitoring needs.
instances:
   - min_collection_interval: 172800
      threads: 32
      api_filter:
         - access_management
   - min_collection_interval: 10
      threads: 32
      api_filter:
         - cloudhub
With the above example, you are running two isolated executions of our metric reader program, if you have a scenario where customization of API calls is needed you can refer to the configuration section to locate the configuration YAML file and set your configuration properly. Once done, you only need to restart the agent to load the new configuration and that's it you will now have a customized agent.
Customize the settings with the UI
The CloudWatch Mule® Integration comes with a bundled web application to assist in the customization of the settings in a graphical user interface, rather than modifying the configuration YAML file directly.
System architecture
Bundled with the CloudWatch Mule® Integration, the web application follows the same system architecture.
The web application uses a plain HTTP connection, meaning it is not encrypted and the information travels in plain text. It’s very important to access this web application in a trusted network, typically, with a VPN.
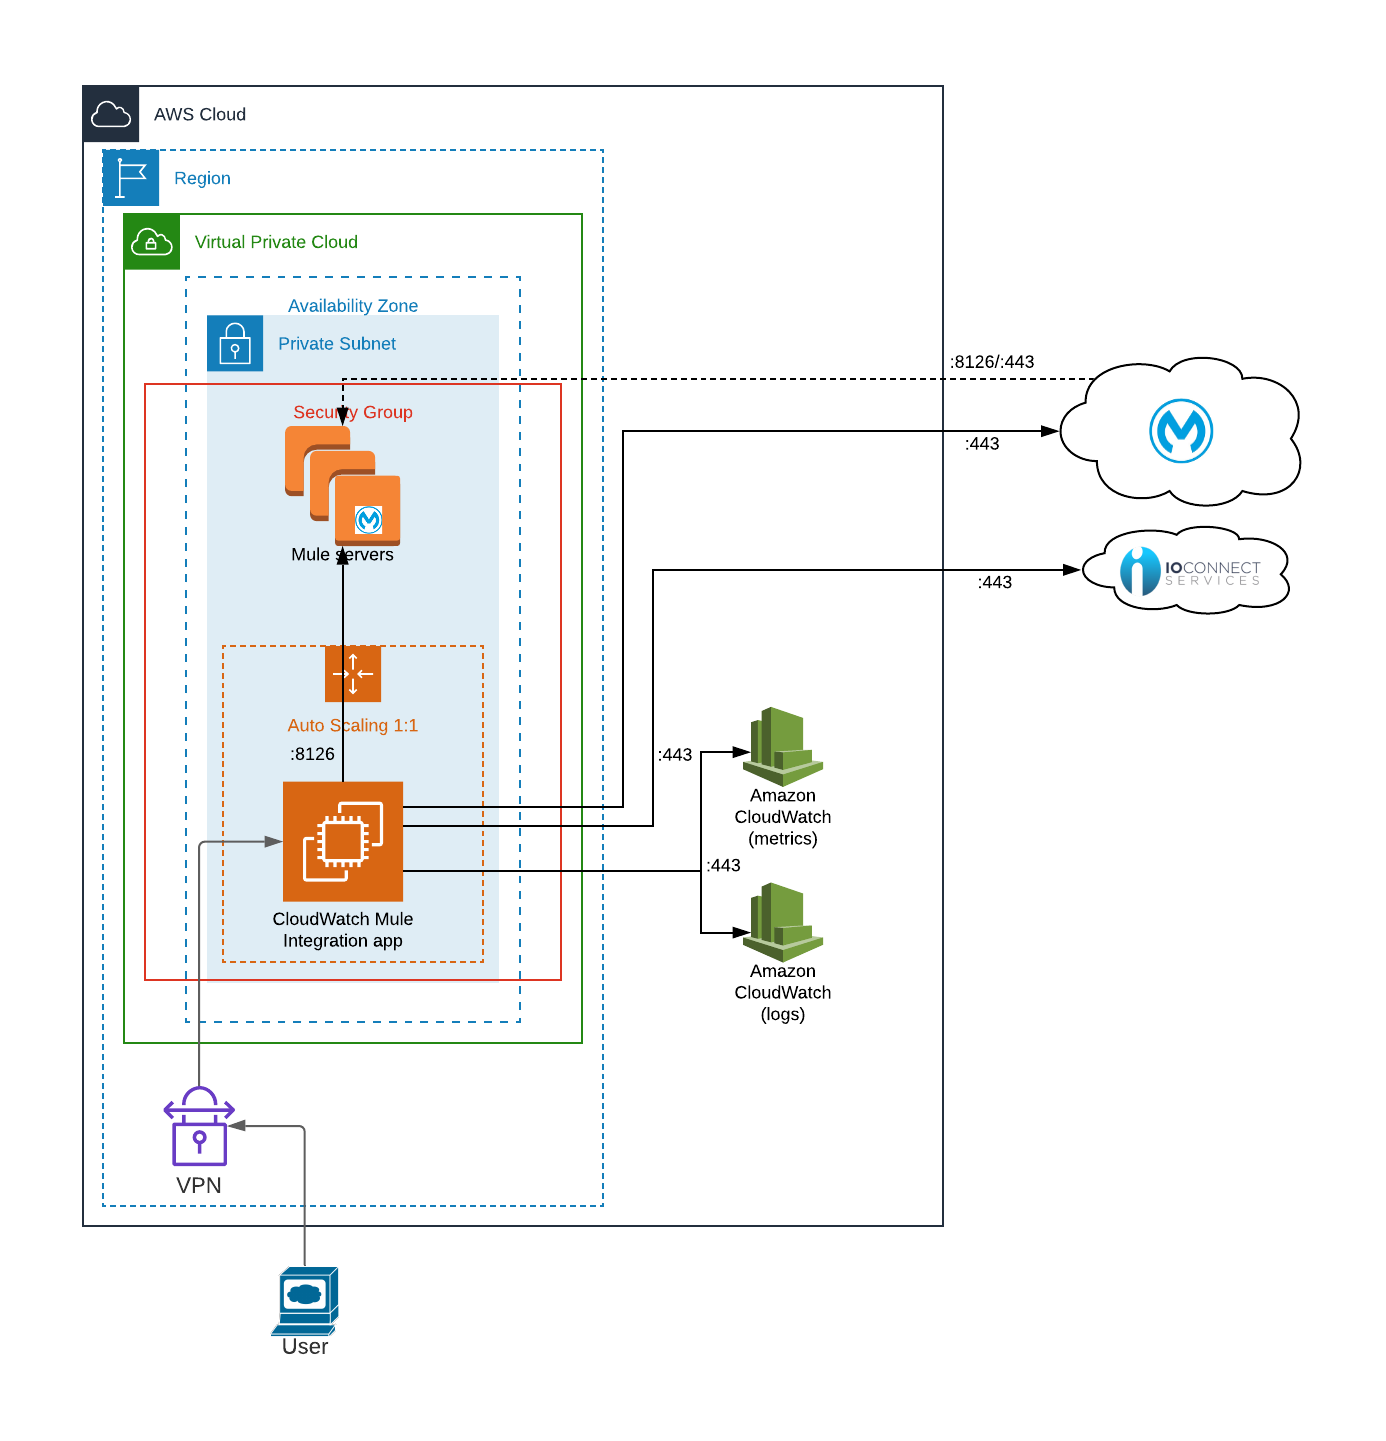
The web application listens to port 8080, and the URL to access it is http://<ec2-instance>:8080/settings
Where <ec2-instance> is the IP address or hostname of the EC2 instance where the CloudWatch Mule® Integration is running.
Installation
This web application comes bundled with the CloudWatch Mule® Integration. Follow steps in https://docs.ioconnectservices.com/cmi/installation
Customization
This web application is a user interface for the conf.yaml file used by the CloudWatch Mule® Integration agent to configure the execution and collection of metrics. See the definition of each field in the configuration.
The UI is divided into sections:
- General
- Anypoint Information.
- MuleSoft Products.
- Advanced settings.
Make sure you save all changes by clicking on the Save button at the bottom of the page. Once the changes are saved, restart the agent.
NOTE: Make sure to restart the agent in the command line. Otherwise, the changes won’t take effect.
CLOUDWATCH MULE® INTEGRATION
Configuration
The CloudWatch Mule® Integration is a CloudWatch custom integration and it is configured through a conf.yml file located at /home/cmi-agent/iocs/conf/conf.yml in Linux systems
The configuration in the conf.yml is divided into two parts:
- init_config: A common part used by all the executions
- instances A list of instances to be scheduled independently
init_config
This section contains the common configuration used by all the instance executions. It contains the following configurations:
- hosts: Grouping of all the hosts' definitions needed to read the metrics out of the Anypoint Platform. Some hosts are specific to some APIs, if so, it is specified in the description:
- anypoint: The Anypoint server host URL. It is preconfigured with https://anypoint.mulesoft.com but it could be different for EU or GOV Mule Regions, see https://docs.mulesoft.com/access-management/managing-users#prerequisites
- object_store_v2: Object Store V2 server host URL. See https://docs.mulesoft.com/object-store/osv2-apis for the full list of available hosts. This host definition is used by the Object Store API. Example value: https://object-store-us-east-1.anypoint.mulesoft.com
- Object Store V2: Object Store V2 Stats API. It is preconfigured with https://object-store-stats.anypoint.mulesoft.com
- mule_server: This is the URL or IP address of the server where a Mule Runtime with the Mule Agent is running. The MULE_SERVER host definition is utilized by the ARM APIs. For example, the value might be http://localhost:9999.
- auth_provider: This is the OAuth Provider URL responsible for obtaining a Bearer token used for making requests to all the APIs. By default, it is preconfigured with https://anypoint.mulesoft.com/accounts/api/v2/oauth2/token. However, please note that it might differ for EU or GOV Mule Regions. For specific configurations in these regions, refer to the documentation at link to documentation, see https://docs.mulesoft.com/access-management/managing-users#prerequisites
- username: The user name for the authentication API
- aws_secret_name: The AWS Secret Manager Name where the password for the authentication API is stored.
- env_id: The Environment ID for environment-specific requests
- org_id: The Organization ID for the requests that require to specify it
- api_key:The API key provided when you purchased the product
- customer_key: The Customer key provided when you purchased the product
- connection_wait_time: The number of seconds that authentication method will wait until the next retry. If not specified it defaults to 2
- connection_attempts_num: The number of retry attempts that the authentication method will perform. If not specified it defaults to 3
In the Full Example section, there is an example of a configuration file with all the values configured.
instances
This section contains a list of instances defined following the YAML list item notation -. Each instance is scheduled independently to run a set of APIs with a specific threads number configuration. Each instance contains the following configurations:
- min_collection_interval: The time in seconds between executions. If not specified it defaults to 15 seconds
- threads: The number of allowed parallel threads running the instance
- api_filter: If not specified, all the APIs are executed, otherwise it must contain a list of APIs to run within the instance following the YAML list item notation
In the Full Example section, there is an example of a configuration file with a list of instances. The example is taken directly from the conf.yml file distributed with the integration and contains the optimum numbers we recommend for almost any scenario for min_collection_interval and threads.
The metric collection of any instance can be disabled at any time by commenting out the whole instance. This means, commenting on the two attributes mentioned above.
Configuration process
The instances section contains a list of instances that were set to a periodicity and concurrency level according to each API-provided information. Even if all these values can be changed, we recommend just go with the defaults.
The main configuration parameters to pay attention to are:
-
object_store_v2.
-
mule_server
-
username
-
aws_secret_name.
-
env_id.
-
org_id.
-
api_key
-
customer_key.
For EU or GOV Mule Regions, the anypointand oauth_provider should be changed too. See https://docs.mulesoft.com/access-management/managing-users#prerequisites
CLOUDWATCH MULE® INTEGRATION
Installation
The CloudWatch Mule® Integration is obtained when you subscribe to the AWS CloudWatch Mulesoft Integration. This will deliver an AMI and a CloudFormation template with all the new to Monitoring Anypoint Metrics into AWS CloudWatch
The AMI contains
-
Ubuntu Server 20.04 LTS
-
Java 11 Stable.
-
CMI Assets
-
CMI daemon script
-
CMI Agent
-
JSVC
-
cmi-agent-role (Role with custom policy)
-
Settings Web App
Installation process
1. Subscribe to the AWS Marketplace
- Go to this link Marketplace link and login with your credentials, Search for the AWS CloudWatch Mulesoft Integration and subscribe.
2. CloudFormation Template
- Once subscribe you will receive a cloudFormation template. In this template, the resources created are an EC2 instance and a security group.
This template requires the user to provide the following parameters:
-
Authentication API
-
Username
-
Password
-
Environment ID
-
Organization ID
-
Customer Key
-
-
EC2 Configuration
-
Instance Type
-
Key Pair
-
VPC ID
-
Subnet ID
-
CIDR IP Range for SSH
-
CIDR IP Range for Web App
-
-
Deployment Environment
-
Deployment Environment (dev, qa, prod, etc)
-