CLOUDWATCH MULE® INTEGRATION
OOTB Assets | Operations
Those widgets work by selecting the time range and the right variables located at the top:
Pro-tip: Configure the MuleSoft organization and environment identifiers and save the view.
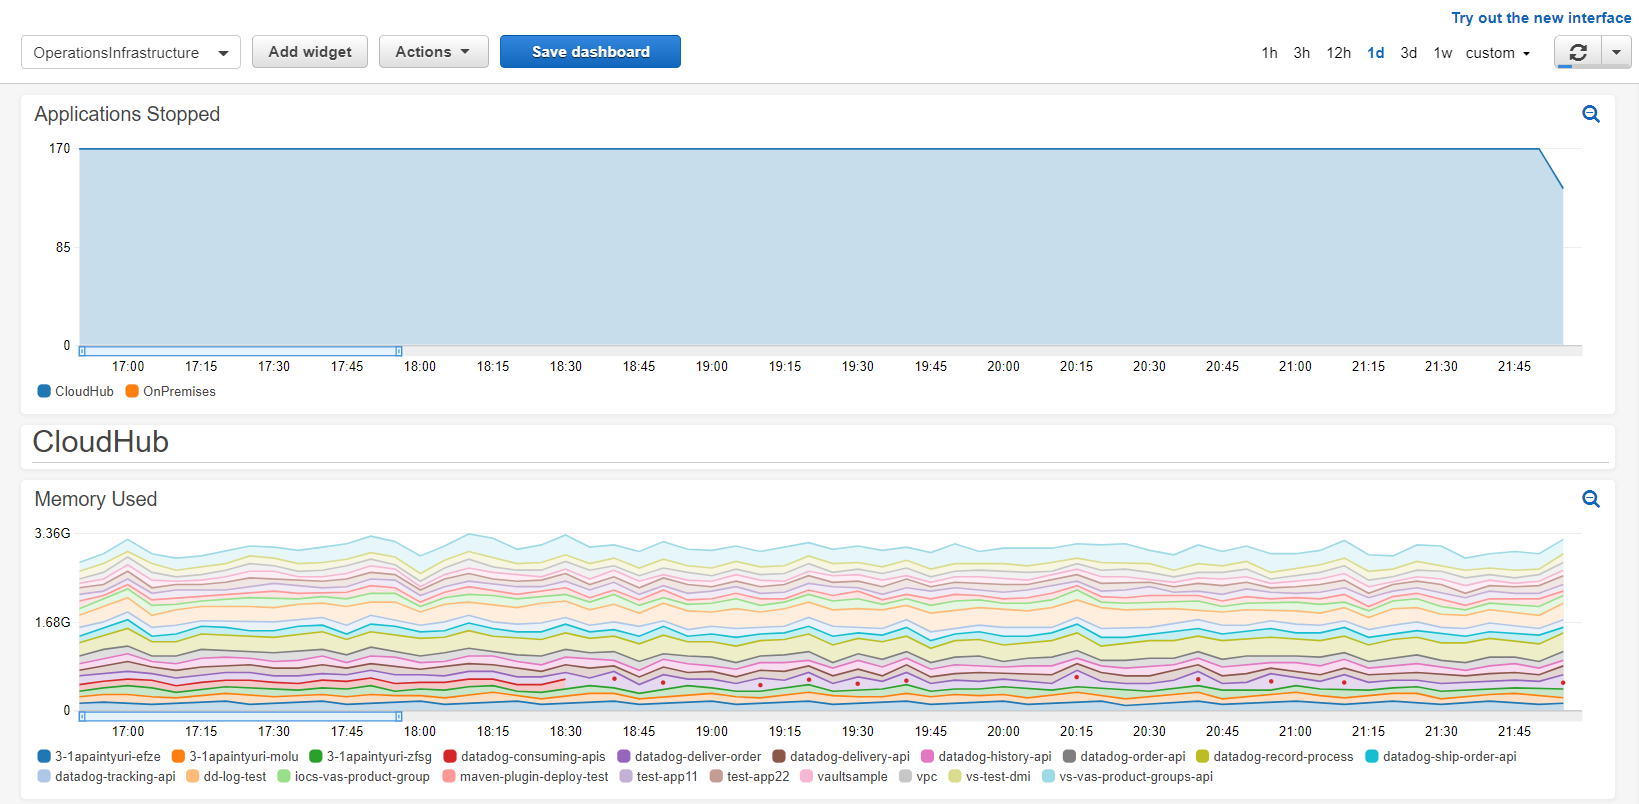
Operations: Infrastructure
The dashboard has two sections:
SECTION CLOUDHOUB:
Shows resource usage by application:
- Memory used
- Memory percentage
- CPU usage
- CPU percentage
- Network in and out
- Message queue and Inflight
SECTION ON-PREMISE:
Shows resource usage by target and machine:
- Memory used
- Memory percentage (base 256 MB)
- CPU used
- Network in and out
COMMON SECTION:
- Applications stopped
It works similar to the dashboard mentioned before, you must select the variables values and time range as needed:


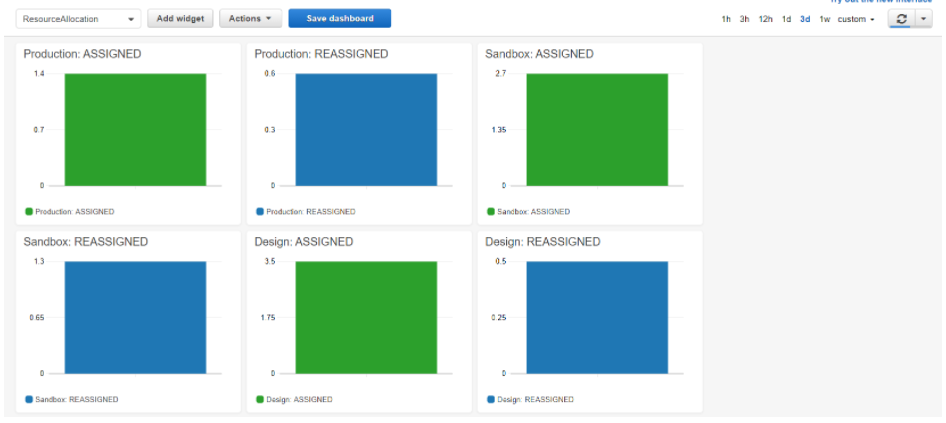
Operations: Resources allocation and usage
This dashboard presents the resources available and used of your infrastructure per main organization.
The dashboard is divided into six sections:
SECTION 1. ORGANIZATION VCORES:
It displays the VCores assigned and reassigned per organization, also has a subsection that shows:
- vCores used by environments
- vCores reassigned per suborganization
- VPNs usage
- VPCs usage
- Load Balancers usage
- Static IPs usage
SECTION 2. RESOURCES USAGE
The next sections include a table that contains resource allocation by organization name, resources reassigned and assigned.
- Organization VPNs
- Organization VPCs
- Organization Load Balancers
- Organization Static IPs
SECTION 3. RESOURCE RE-ALLOCATION
Resources from Anypoint Platform in an organization can be reassigned to a sub-organization. The next collapsible sections show how these resources are reassigned to sub-organizations.
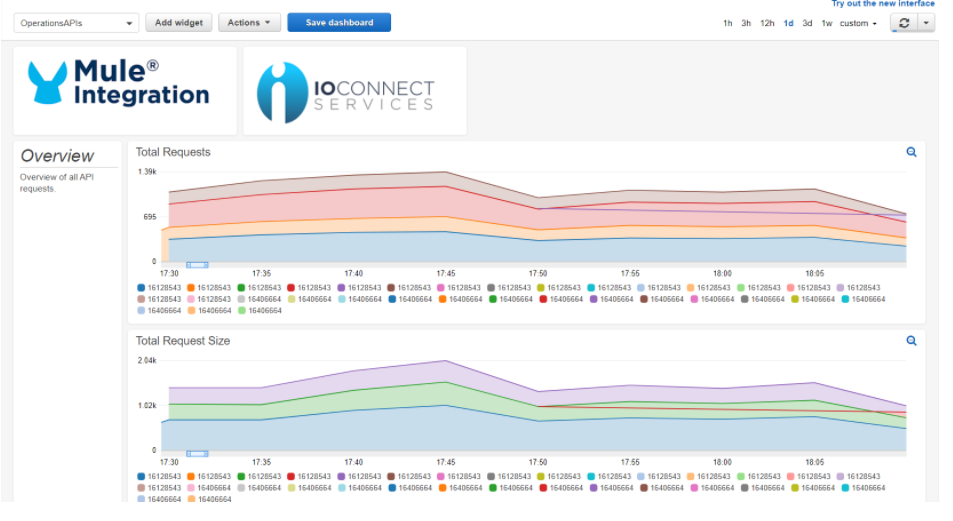
Operations: APIs
- Total Requests
- Total Request Size
- Total Response Size
- Average Response
- Total Failed Requests 1xx & 3xx
- Total Failed Requests 4xx
- Total Failed Requests 5xx
Development: Optimizations
The dashboard displays basic information about CloudHub applications and On-Premise servers.
It is divided into CloudHub and On-Premise sections that shows:
- CPU used
- Memory used
- Network in and out