DATADOG MULE® INTEGRATION
OOTB Assets | Operations
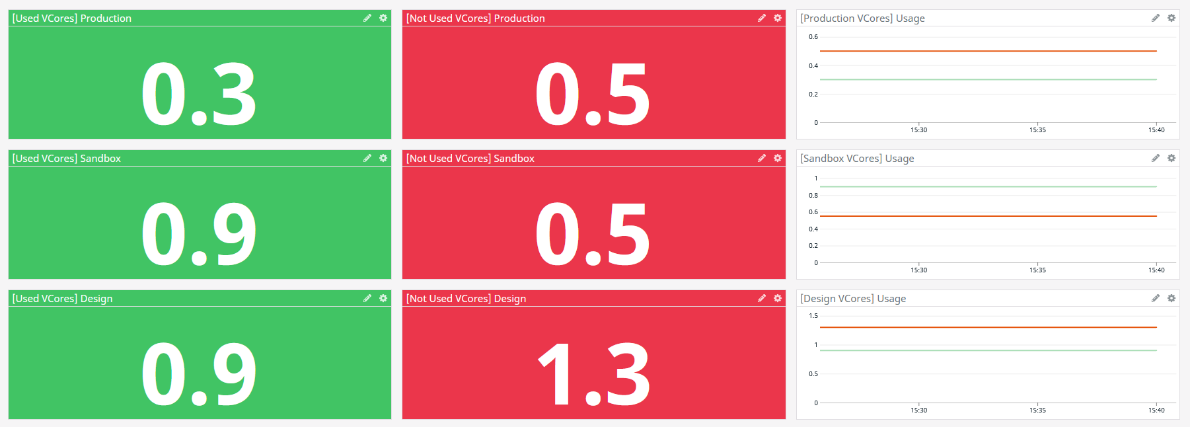
Operations: Resources allocation and usage
Pro tip:
Configure the MuleSoft organization and environment identifiers and save the view. See how you can obtain the identifiers and save the view in the Datadog dashboard in the prerequisites.
This dashboard presents the resources available and used of your infrastructure per main organization.
The dashboard is divided into six sections:
Section 1. ORGANIZATION vCORES
It displays the VCores assigned and reassigned per organization, also has a subsection that shows:
- vCores used by environments
- vCores reassigned per suborganization
- VPNs usage
- VPCs usage
- Load Balancers usage
- Static IPs usage
Section 2. RESOURCES USAGE
The next sections include a table that contains resource allocation by organization name, resources reassigned and assigned.
- Organization VPNs
- Organization VPCs
- Organization Load Balancers
- Organization Static IPs
Section 3. RESOURCE RE-ALLOCATION
Resources from Anypoint Platform in an organization can be reassigned to a sub-organization. The next collapsible sections show how these resources are reassigned to sub-organizations.
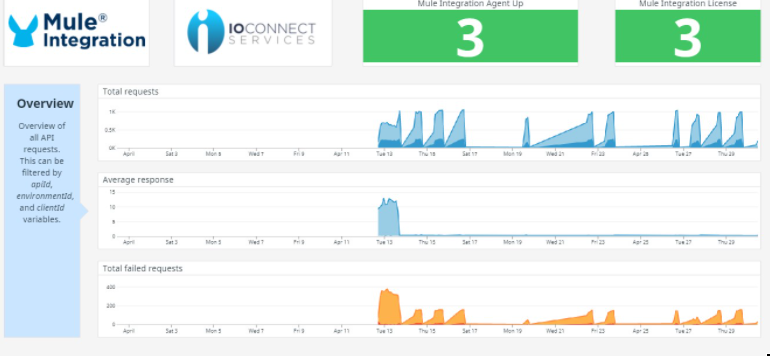
Operations: APIs
Pro tip:
Configure the MuleSoft environment, client application and API instance identifiers and save it. See how you can obtain the identifiers and save the view in the Datadog dashboard in the pre-requisites.
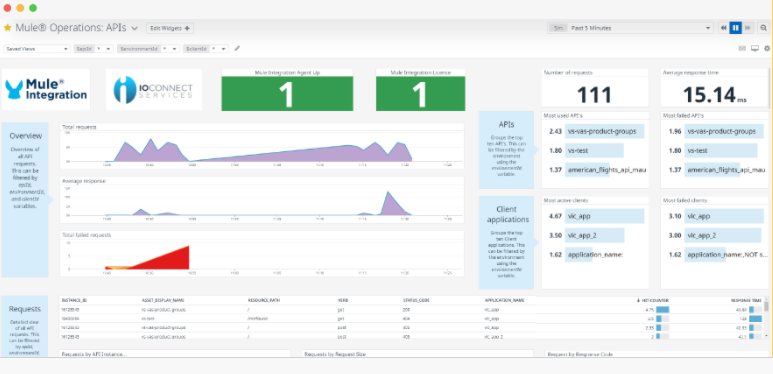
The dashboard is divived into 4 sections:
- Overview
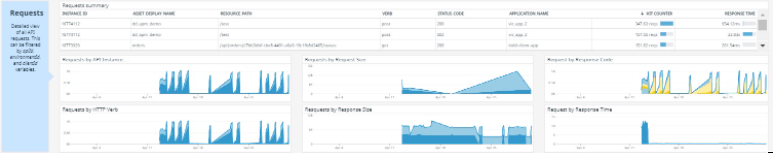
- Requests summary
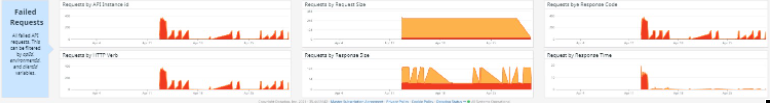
- Failed requests summary
- Top 10
The overview displays a summary of the total of requests, response time and failed requests. Basically it groups the data obtained from the HTTP requests through the Mule event. You can filter out this dashboard by apiId, environment and clientId.
Requests summary section contains the gathered data of the HTTP request organized by different aspects of the HTTP protocol, such as verb, request and response size, code, and time. It also shows a summary of the requests identifying the client application.
The Failed request summary is much the same as the above section groups the failed request by the metadata of the HTTP protocol.
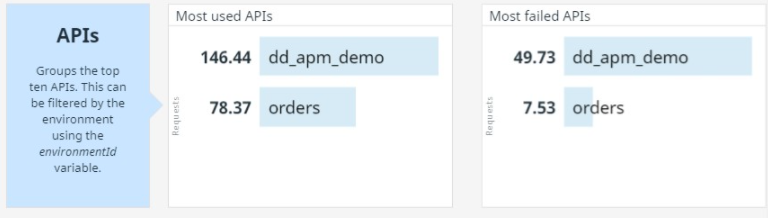
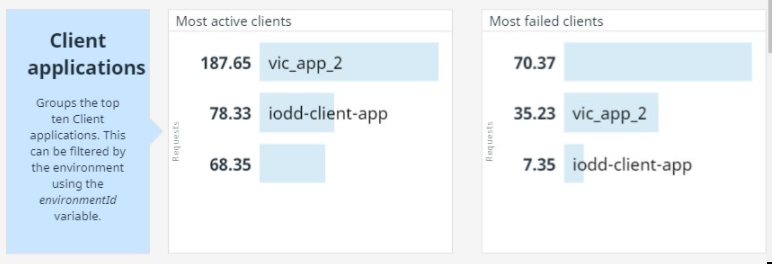
Final section, it's the Top 10's, here a list of the most used APIs, active clients, failed APIs and clients, is displayed.
Along with the sections depicted above, the dashboard shows the health of the Datadog Mule Integration and Datadog Agents.
Here a full image of how it looks.
Development: Optimizations
The dashboard displays basic information about CloudHub applications and On-Premise servers.
It is divided into CloudHub and On Premise sections that shows:
- CPU used
- Memory used
- Network in and out
For CloudHub section, you can select it by application and environment, for On-Premise section by target and host: