DATADOG MULE® INTEGRATION
OOTB Assets | Operations
Operations: Resources allocation and usage
Pro tip:
Configure the MuleSoft organization and environment identifiers and save the view. See how you can obtain the identifiers and save the view in the Datadog dashboard in the prerequisites.
This dashboard presents the resources available and used of your infrastructure per main organization.
The dashboard is divided into six sections:
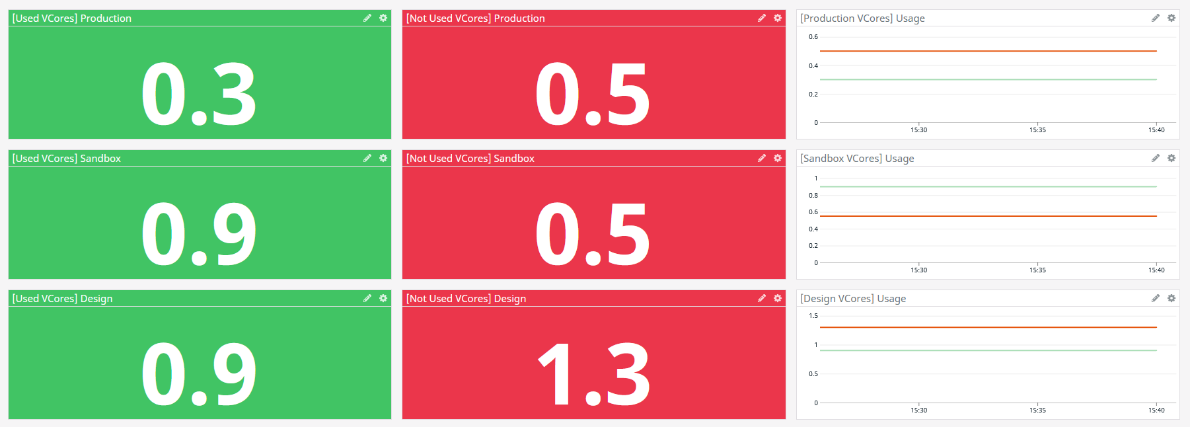
Section 1. ORGANIZATION vCORES
It displays the VCores assigned and reassigned per organization, also has a subsection that shows:
- vCores used by environments
- vCores reassigned per suborganization
- VPNs usage
- VPCs usage
- Load Balancers usage
- Static IPs usage
Section 2. RESOURCES USAGE
The next sections include a table that contains resource allocation by organization name, resources reassigned and assigned.
- Organization VPNs
- Organization VPCs
- Organization Load Balancers
- Organization Static IPs
Section 3. RESOURCE RE-ALLOCATION
Resources from Anypoint Platform in an organization can be reassigned to a sub-organization. The next collapsible sections show how these resources are reassigned to sub-organizations.
Operations: APIs
Pro tip:
Configure the MuleSoft environment, client application and API instance identifiers and save it. See how you can obtain the identifiers and save the view in the Datadog dashboard in the pre-requisites.
The dashboard is divived into 4 sections:
- Overview
- Requests summary
- Failed requests summary
- Top 10
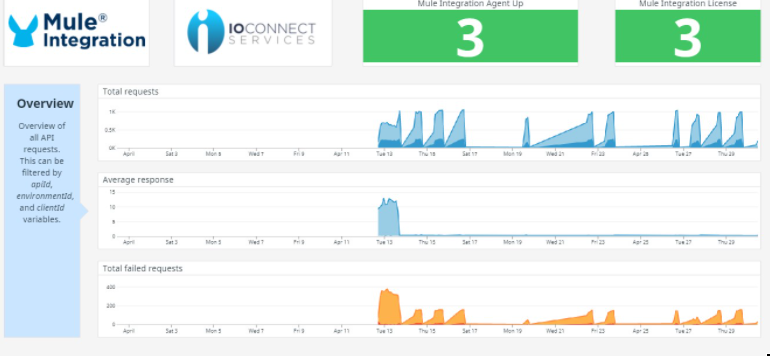
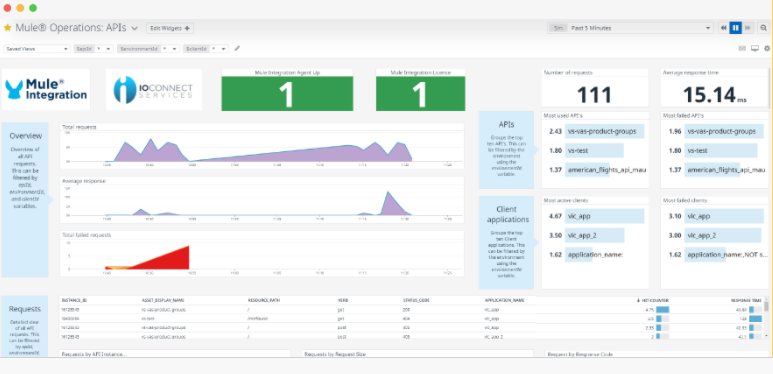
The overview displays a summary of the total of requests, response time and failed requests. Basically it groups the data obtained from the HTTP requests through the Mule event. You can filter out this dashboard by apiId, environment and clientId.
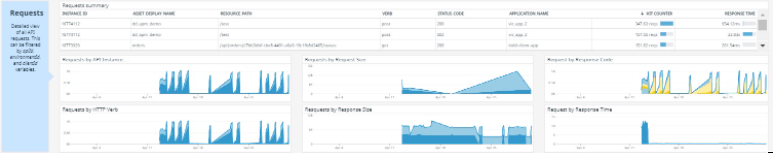
Requests summary section contains the gathered data of the HTTP request organized by different aspects of the HTTP protocol, such as verb, request and response size, code, and time. It also shows a summary of the requests identifying the client application.
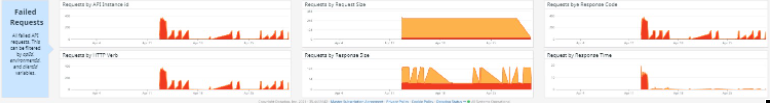
The Failed request summary is much the same as the above section groups the failed request by the metadata of the HTTP protocol.
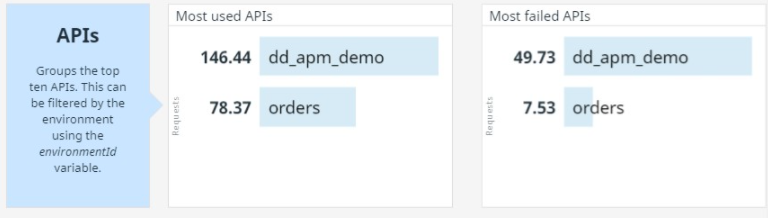
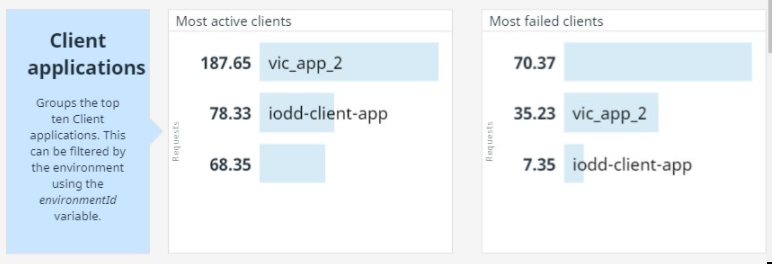
Final section, it's the Top 10's, here a list of the most used APIs, active clients, failed APIs and clients, is displayed.
Along with the sections depicted above, the dashboard shows the health of the Datadog Mule Integration and Datadog Agents.
Here a full image of how it looks.
Development: Optimizations
The dashboard displays basic information about CloudHub applications and On-Premise servers.
It is divided into CloudHub and On Premise sections that shows:
- CPU used
- Memory used
- Network in and out
For CloudHub section, you can select it by application and environment, for On-Premise section by target and host:
DATADOG MULE® INTEGRATION
OOTB Assets | Monitors
Monitors
Monitors help to constantly keep track of specific events, triggering an alert or notification whenever such events fulfill a condition. Datadog Mule® Integration comes with pre built-in monitors for events of failures in the Mule applications or servers.
Go to the monitors list by clicking at the side bar:
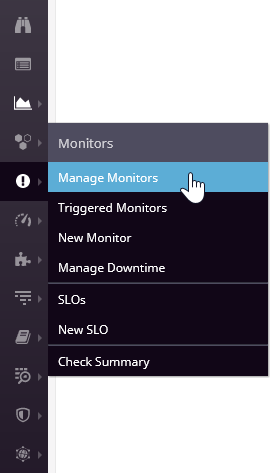
It should be a list like this one:
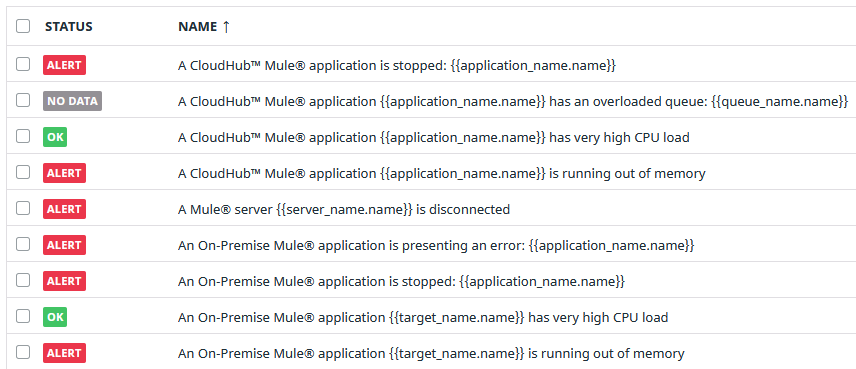
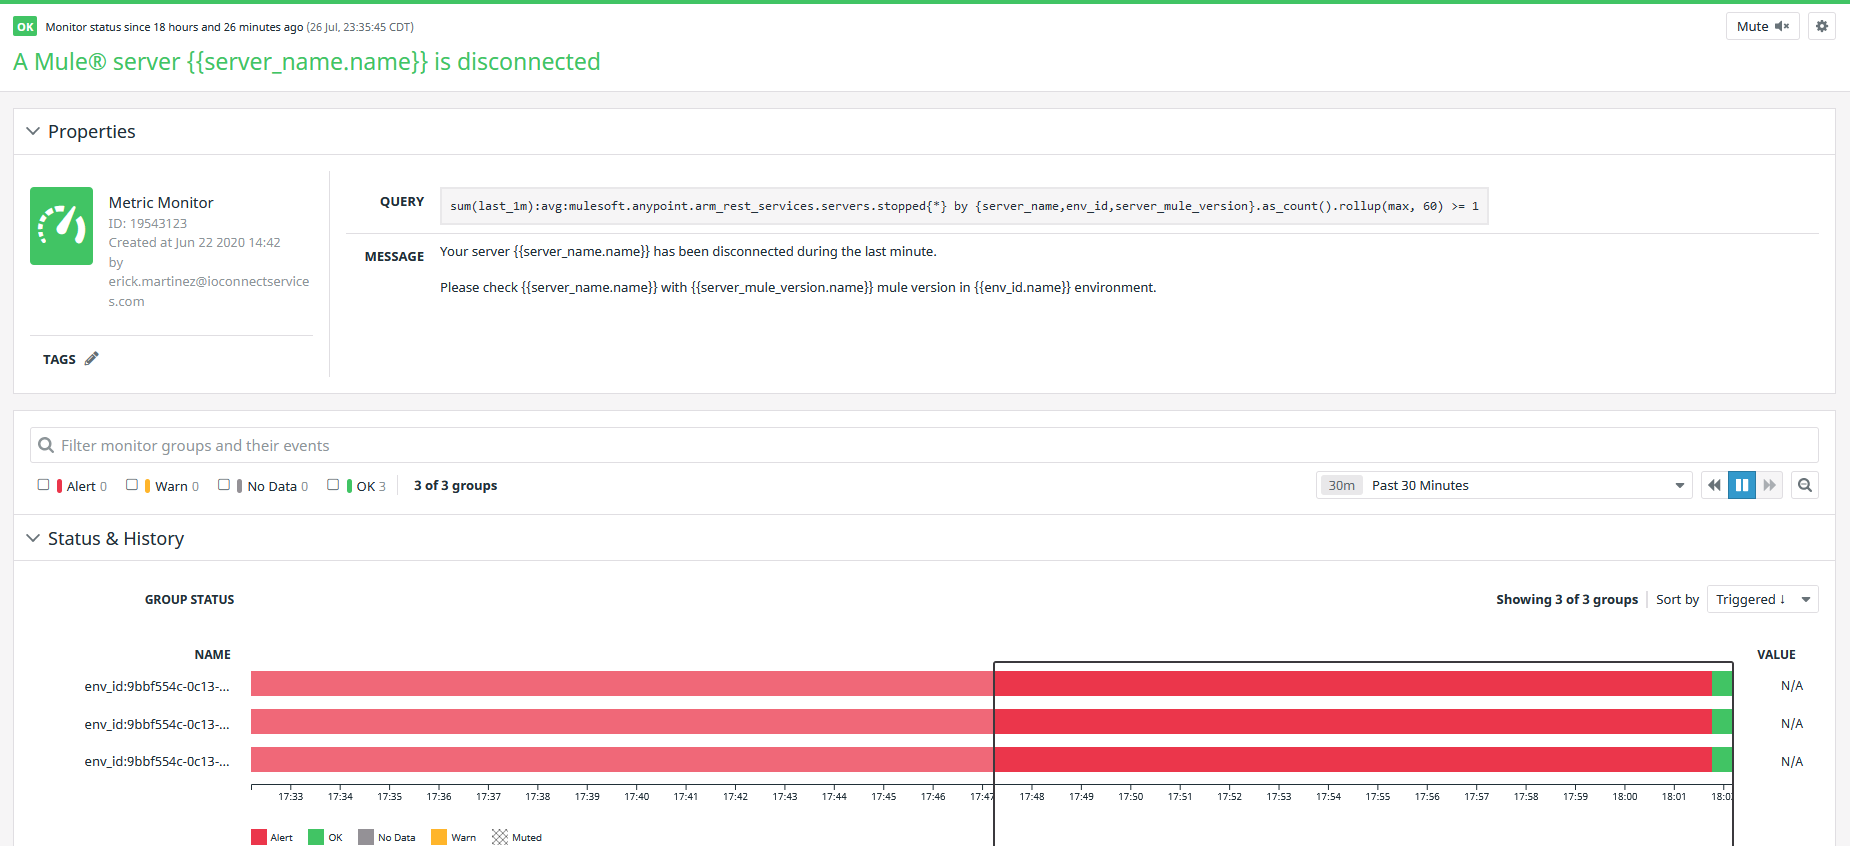
All monitors have the same structure, but each one is configured with specific metrics. The monitor is triggered based on thresholds already set.
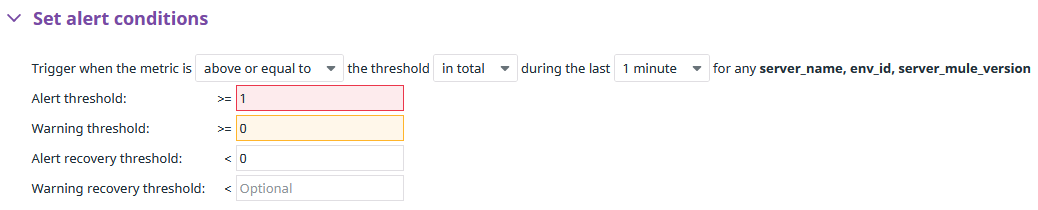
If you open a monitor in the Edit section, you will find the alert threshold value defined by default. This is different for each monitor:
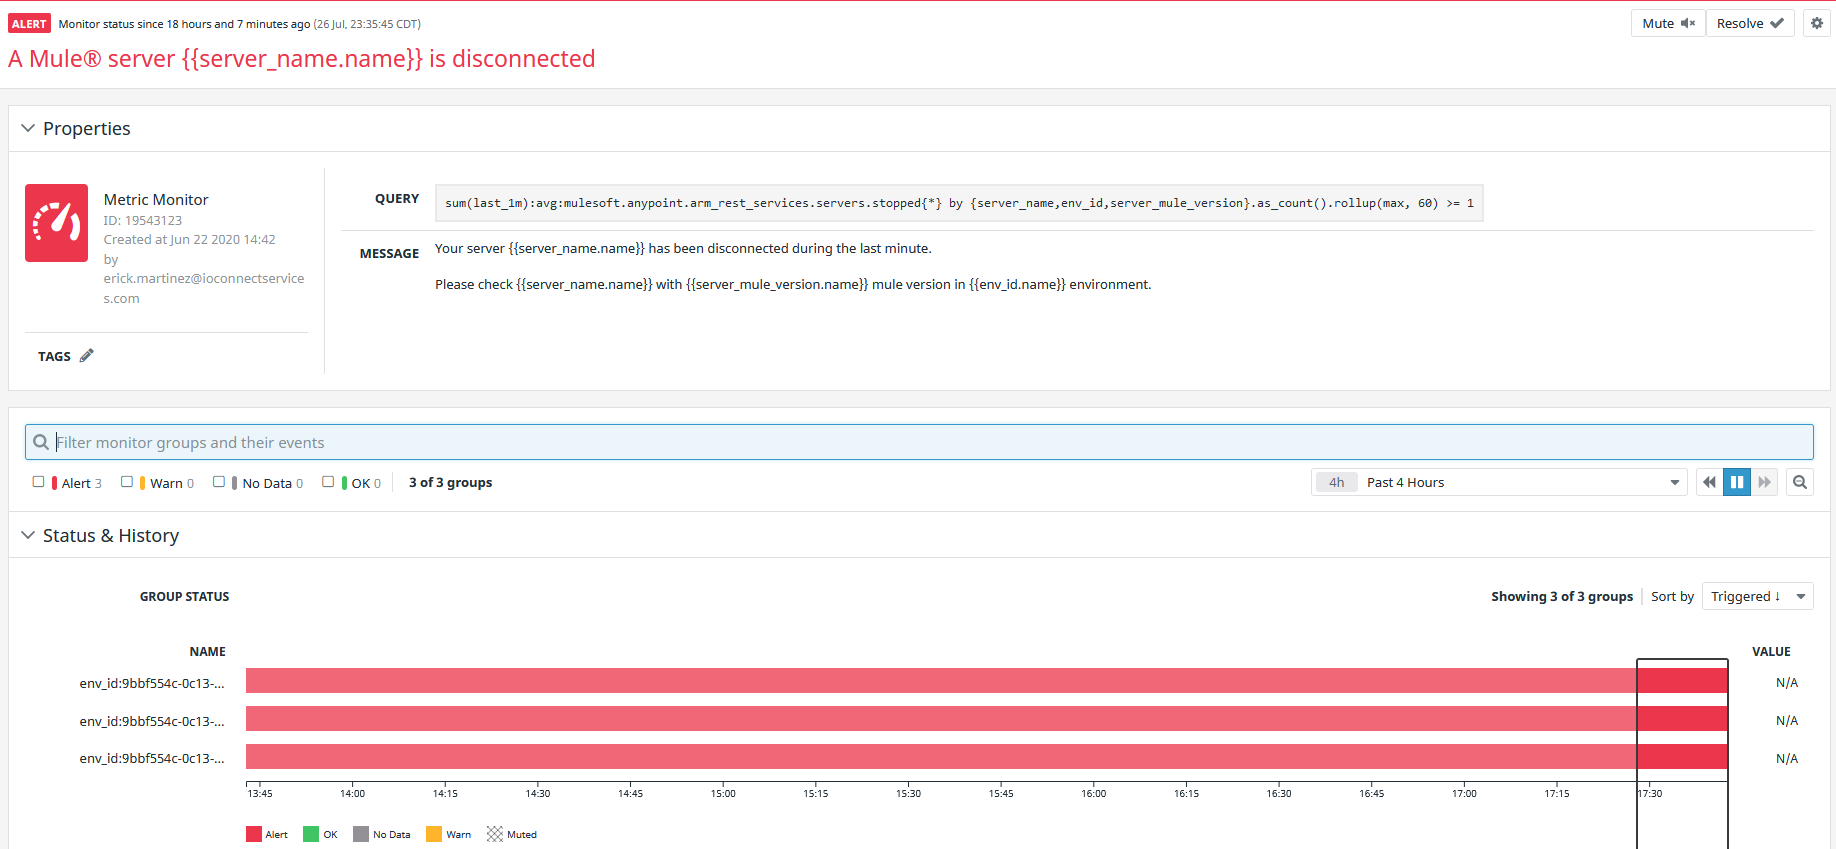
If the alert is triggered, the monitor is going to change to red color, like the image below:
You can indicate in the monitor that the issue is fixed by clicking the Resolve button at the top-right corner, the Alert will change the status to OK and the color from red to green:
Once updated to “Resolve”, the Alert Monitor widget in the dashboards, also will be updated to OK status.
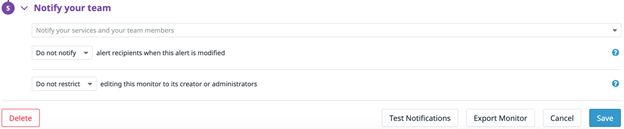
All alerts can be configured to trigger alerts. This is done by configuring the email address, Slack channel or other communication medium that is configured in your Datadog instance. Click on the “Edit” button on the monitor and scroll down to the Notify your team section and configure accordingly.
To learn more about monitors go to https://docs.datadoghq.com/monitors/
DATADOG MULE® INTEGRATION
Configuration | Connected Apps
The Connected Apps permissions
The Datadog Mule® Integration relies on specific permissions within the MuleSoft Anypoint Platform to collect metrics. To grant these permissions, a Connected App is used. Follow the instructions in the official MuleSoft documentation to create a Connected App.
https://docs.mulesoft.com/access-management/connected-apps-overview
The Connected App has to be of the type App acts on its own behalf (client credentials).
The Datadog Mule Integration requires the "View Organization" permission to collect metrics.
Here's a breakdown of the required permissions for different set of metrics:
Access Management:
- READ APPLICATIONS
API Events:
This permission is solely for reading data from API Manager. Datadog Mule® Integration does not modify any modifications.
- API GROUP ADMINISTRATOR
- VIEW APIS CONFIGURATION
- VIEW POLICIES
API Manager:
This permission is solely for reading data from API Manager. Datadog Mule® Integration does not modify any modifications.
- API GROUP ADMINISTRATOR
- VIEW CONTRACTS
- VIEW POLICIES
ARM Monitoring Query:
- READ APPLICATIONS
- READ SERVERS
ARM Mule Agent:
This API needs on premise mule server and configure in conf.yaml.
ARM Rest Services
- READ ALERTS
- READ APPLICATIONS
- READ SERVERS
CloudHub:
This is only required to read data from CloudHub. Datadog Mule® Integration does not modify any asset.
- CLOUDHUB ORGANIZATION ADMIN
- READ ALERTS
Exchange Experience API:
This is only required to read data from Exchange. Datadog Mule® Integration does not modify any asset.
- EXCHANGE ADMINISTRATOR
INSIGHT:
This is only required to read data from CloudHub. Datadog Mule® Integration does not modify any asset.
- CLOUDHUB ORGANIZATION ADMIN
Object Store:
- MANAGE APPLICATION DATA
- STORES METRICS VIEWER
- MANAGE STORES DATA
- VIEW STORE CLIENTS
Object Store V2 Stats:
This is only required to read data from Object Store V2 statistics. Datadog Mule® Integration does not modify any asset. If these metrics are not desired, make sure you comment out this entry in the configuration file in instances .
- AN ADMINISTRATOR USER
- MANAGE STORES DATA
- STORE METRICS VIEWER
- VIEW STORE CLIENTS
Runtime Fabric:
- MANAGE RUNTIME FABRICS
- READ APPLICATIONS
The integration does not modify in any manner the assets in Anypoint Platform, those permissions are for read-only.
Full example
Below is a complete configuration example (with fake credentials and ids):
init_config:
  hosts:
    anypoint: https://anypoint.mulesoft.com
    object_store_v2: https://object-store-us-east-1.anypoint.mulesoft.com
    object_store_v2_stats: https://object-store-stats.anypoint.mulesoft.com
    # mule_server: <ON_PREMISE_MULE_SERVER>
    oauth_provider: https://anypoint.mulesoft.com/accounts/api/v2/oauth2/token
    basic_auth_provider: https://anypoint.mulesoft.com/accounts/login

  client_id: 035715123cbc31a123456a43143213f3
  client_secret: bAc2345678C34aFF1aB1A12f5A245678
  env_id: a3cc1234-4a24-125b-1a45-1c1aa1a13cad
  org_id: ac2345aa-cc13-1367-bca1-b1234a2aa4aa
  customer_key: a6a6-b5568ae854e5
  connection_wait_time: 2
  connection_attempts_num: 3

instances:
  - min_collection_interval: 86400
    threads: 32
    api_filter:
      - access_management
  - min_collection_interval: 10
    threads: 32
    api_filter:
      - arm_monitoring_query
  - min_collection_interval: 10
    threads: 32
    api_filter:
      - arm_mule_agent
  - min_collection_interval: 10
    threads: 32
    api_filter:
      - arm_rest_services
  - min_collection_interval: 10
    threads: 32
    api_filter:
      - cloudhub
  - min_collection_interval: 60
    threads: 32
    api_filter:
      - api_manager
  - min_collection_interval: 60
    threads: 32
    api_filter:
      - api_events
  - min_collection_interval: 86400
    threads: 32
    api_filter:
      - exchange_experience
  - min_collection_interval: 60
    threads: 32
    api_filter:
      - insight
  - min_collection_interval: 86400
    threads: 32
    api_filter:
      - object_store
  - min_collection_interval: 86400
    threads: 32
    api_filter:
      - object_store_v2_stats
CLOUDWATCH MULE® INTEGRATION
Customization | General
General
This section contains only general information on the configuration settings.

- Customer Key: This is the activation key of the product. It’s granted by IO Connect Services when purchasing the product and activating it for the first time.
Anypoint Information
This section contains information about the Anypoint Platform.
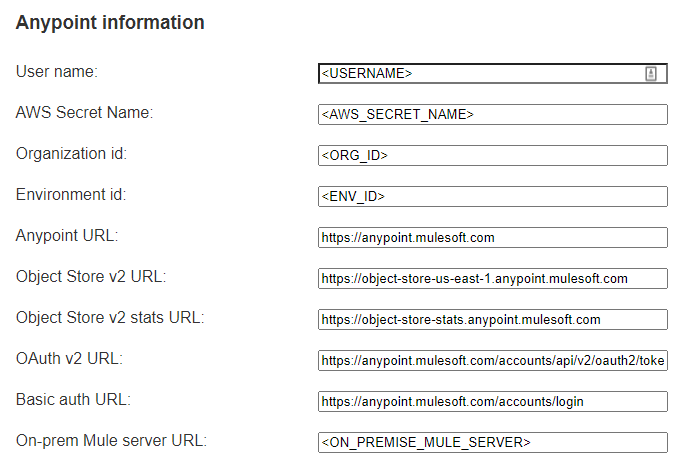
- User name: The user created in Anypoint Platform with privileges to collect metrics from the different products.
- AWS Secret Name: The name of the key created at deployment time where the user’s password is securely stored in AWS Secrets Manager.
- Organization Id: The Id of the Anypoint Organization. To know this value, read the official MuleSoft documentation https://docs.mulesoft.com/access-management/organization#manage-master-organization-settings
- Environment Id: The Id of the target environment in Anypoint. To know this value, read this official article from MuleSoft https://help.mulesoft.com/s/article/How-to-get-the-Environment-ID
- Anypoint URL: The Anypoint server host URL. It is preconfigured with https://anypoint.mulesoft.com but it could be different for EU or GOV Mule Regions, see https://docs.mulesoft.com/access-management/managing-users#prerequisites.
- Object Store V2 URL: The Specific Region Object Store V2 server host URL. See https://docs.mulesoft.com/object-store/osv2-apis for the full list of available hosts. This host definition is used by the Object Store API. Example value: https://object-store-us-east-1.anypoint.mulesoft.com.
- Object Store stats URL: The Object Store V2 Stats server host URL. This host definition is used by the Object Store V2 Stats API. It is preconfigured with https://object-store-stats.anypoint.mulesoft.com.
- OAuth v2 URL: The OAuth v2 Provider URL allows obtaining a Bearer token used to make requests to all the APIs. It is preconfigured with https://anypoint.mulesoft.com/accounts/api/v2/oauth2/token but it could be different for EU or GOV Mule Regions, see https://docs.mulesoft.com/access-management/managing-users#prerequisites
- Basic Auth URL: The URL to do basic authentication to make requests to all the APIs. It is preconfigured with https://anypoint.mulesoft.com/accounts/login but it could be different for EU or GOV Mule Regions, see https://docs.mulesoft.com/access-management/managing-users#prerequisites
- On-prem Mule Server URL: The URL or IP of the Server running a Mule Runtime with the Mule Agent. This host definition is used by the ARM APIs Example value: http://localhost:9999
MuleSoft Products
This section covers what are the MuleSoft products from which the CloudWatch Mule® Integration agent will collect metrics.
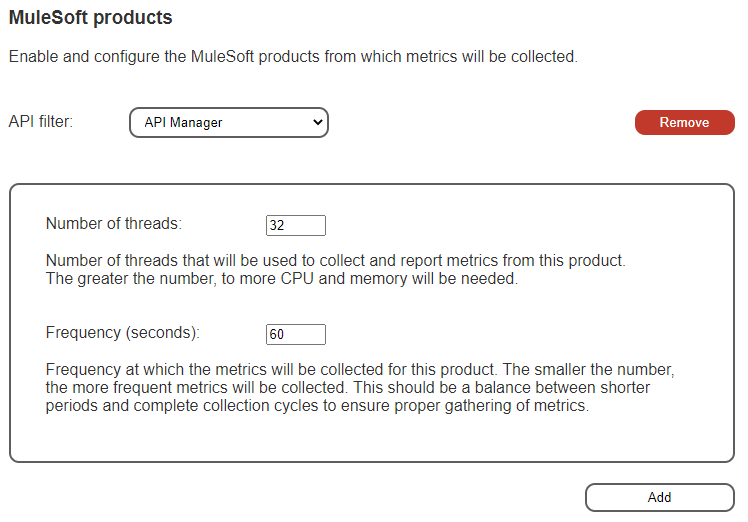
- API filter: This is the MuleSoft product that will be enabled. Pick one from the drop-down list.
- Number of threads: This shows an explanation below the control. Specifies the number of threads used to collect metrics from this specific product. Use this setting to tune the performance of the metrics collection.
- Frequency (seconds): The frequency at which this agent will trigger the metric collection for this MuleSoft product. It is specified in seconds.
To add more products to the list of managed products for this CloudWatch Mule® Integration agent, click on the Add button at the bottom of the section.
To remove a product from the list of managed products, click on the Remove button.
Advanced Settings
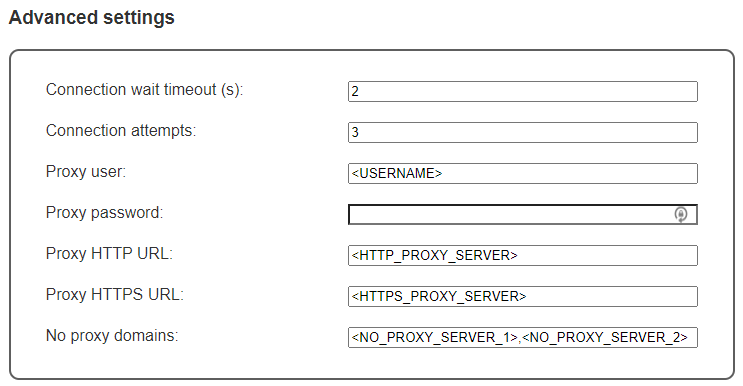
This section contains settings that will be updated only under specific circumstances.
- Connection wait timeout (s): The number of seconds that the authentication method will wait until the next retry. If not specified it defaults to 2 seconds.
- Connection attempts: The number of retry attempts that the authentication method will perform. If not specified it defaults to 3 attempts.
- Proxy user: The user name of the proxy if the instance where the CloudWatch Mule® Integration agent is deployed is behind a secured proxy.
- Proxy password: The password of the user of the proxy if the instance where the CloudWatch Mule® Integration agent is deployed is behind a secured proxy.
- Proxy HTTP URL: The IP address or hostname of the proxy server. This control is used if the proxy is used for HTTP only.
- Proxy HTTPS URL: The IP address or hostname of the proxy server. This control is used if the proxy is used for HTTPS only.
- No proxy domains: The domains that are not required to go through a proxy. It skips the proxy routing.
Troubleshooting
The web application is not running
To diagnose that the application is not running, you need to SSH into the EC2 instance where it is supposed to be running. In the command line, use the following command to make sure the process is not running.
$ ps -ef | grep "com.ioconnectservices.cmi.web.CmiSettingsWebAppApplication"
If the command above does not return a valid process, then it might be down. Use the following command to start it.
$ sudo -u cmi-agent java -Dconf.file.location="/home/cmi-agent/iocs/conf/conf.yml" -jar "/home/cmi-agent/iocs/cmi/cmi-settings-web-app-1.0.0.jar" "com.ioconnectservices.cmi.web.CmiSettingsWebAppApplication"
To test the process open a web browser and go to the settings web application http://<ec2-instance>:8080/settings
The web application is not storing any new settings
Make sure that the user that runs the web application process has write permissions over the conf.yaml file. By default, both file and Java processes are run with the cmi-user user.
CLOUDWATCH MULE® INTEGRATION
Configuration | The Service
The service user permissions
CloudWatch Mule® Integration requires specific permissions on the MuleSoft Anypoint Platform to collect metrics.
There are some common permissions that must be granted to be able to execute any API and others, specific, used by one or few APIs.
-
Exchange API:
o Exchange Administrator
This is only required to read data from Exchange. CloudWatch Mule® Integration does not modify any asset.
-
CloudHub:
o CloudHub Organization Admin
This is only required to read data from CloudHub. CloudWatch Mule® Integration does not modify any asset.
o Read Alerts
-
ARM Rest Services
o Read Alerts
o Read Applications
o Read Servers
-
Access Management:
o Read Applications
o View Organization
- ARM Monitoring Query:
o Read Applications
-
Object Store:
o Manage Application Data
o Manage stores data
-
Object Store V2 Stats:
o An administrator user
This is only required to read data from Object Store V2 statistics. CloudWatch Mule® Integration does not modify any asset. If these metrics are not desired, make sure you comment out this entry in the configuration file in instances.
The integration does not modify in any manner the assets in Anypoint Platform, those permissions are for read-only.
Full example
Below is a complete configuration example (with fake credentials and ids):
init_config:

    hosts:

          anypoint: https://anypoint.mulesoft.com

          object_store_v2: https://object-store-us-east-1.anypoint.mulesoft.com

          object_store_v2_stats: https://object-store-stats.anypoint.mulesoft.com

          mule_server: http://localhost:9999

          oauth_provider: https://anypoint.mulesoft.com/accounts/api/v2/oauth2/token

    client_id: 035715123cbc31a1234a43143213f3

    client_secret: bAc2345678C34aFB1A12f5A245678

    env_id: a3cc1234-4a24-125b-1a45-1c1aa13cad

    org_id: ac2345aa-cc13-1367-bca1-b12aa4aa

    api_key: 548f-1s52-2d5f4f4ed

    customer_key: a6a6-b5e854e5

    connection_wait_time: 2

    connection_attempts_num: 3

instances:

  - min_collection_interval: 86400

    threads: 32

    api_filter:

      - access_management

  - min_collection_interval: 10

    threads: 32

    api_filter:

      - arm_monitoring_query

  - min_collection_interval: 10

    threads: 32

    api_filter:

      - arm_mule_agent

  - min_collection_interval: 10

    threads: 32

    api_filter:

      - arm_rest_services

  - min_collection_interval: 10

    threads: 32

    api_filter:

      - cloudhub

  - min_collection_interval: 86400

    threads: 32

    api_filter:

      - exchange_experience

  - min_collection_interval: 60

    threads: 32

    api_filter:

      - insight

  - min_collection_interval: 86400

    threads: 32

    api_filter:

      - object_store

  - min_collection_interval: 86400

    threads: 32

    api_filter:

      - object_store_v2_stats
CLOUDWATCH MULE® INTEGRATION
OOTB Assets | Operations
Those widgets work by selecting the time range and the right variables located at the top:
Pro-tip: Configure the MuleSoft organization and environment identifiers and save the view.
Operations: Infrastructure
The dashboard has two sections:
SECTION CLOUDHOUB:
Shows resource usage by application:
- Memory used
- Memory percentage
- CPU usage
- CPU percentage
- Network in and out
- Message queue and Inflight
SECTION ON-PREMISE:
Shows resource usage by target and machine:
- Memory used
- Memory percentage (base 256 MB)
- CPU used
- Network in and out
COMMON SECTION:
- Applications stopped
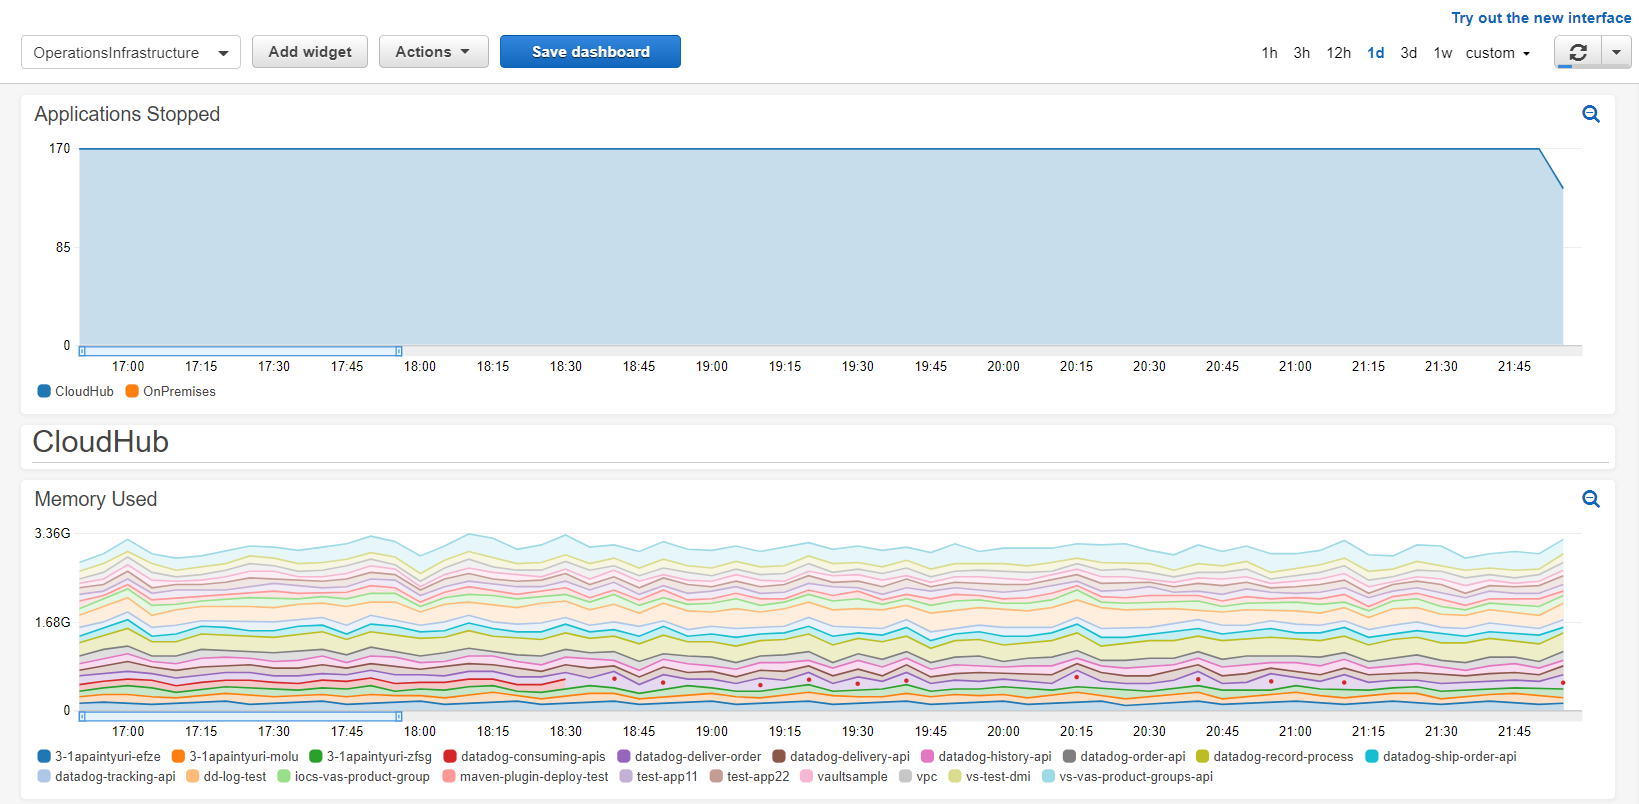
It works similar to the dashboard mentioned before, you must select the variables values and time range as needed:


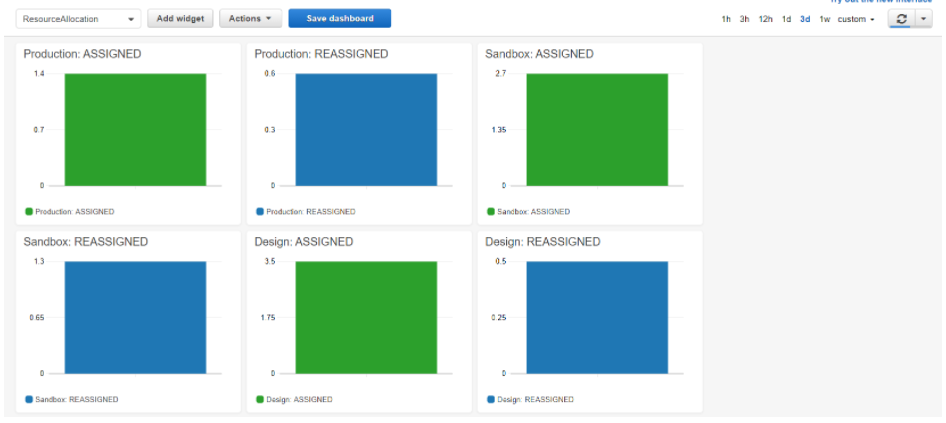
Operations: Resources allocation and usage
This dashboard presents the resources available and used of your infrastructure per main organization.
The dashboard is divided into six sections:
SECTION 1. ORGANIZATION VCORES:
It displays the VCores assigned and reassigned per organization, also has a subsection that shows:
- vCores used by environments
- vCores reassigned per suborganization
- VPNs usage
- VPCs usage
- Load Balancers usage
- Static IPs usage
SECTION 2. RESOURCES USAGE
The next sections include a table that contains resource allocation by organization name, resources reassigned and assigned.
- Organization VPNs
- Organization VPCs
- Organization Load Balancers
- Organization Static IPs
SECTION 3. RESOURCE RE-ALLOCATION
Resources from Anypoint Platform in an organization can be reassigned to a sub-organization. The next collapsible sections show how these resources are reassigned to sub-organizations.
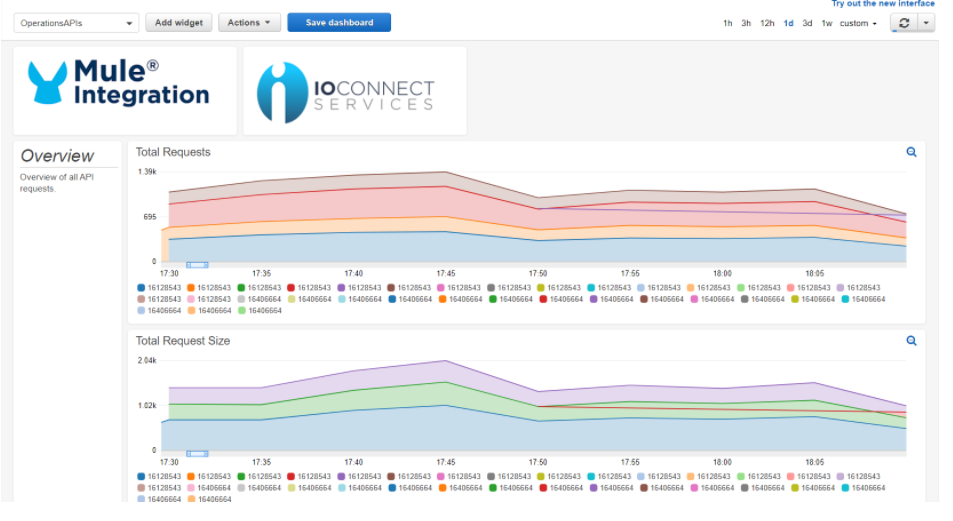
Operations: APIs
- Total Requests
- Total Request Size
- Total Response Size
- Average Response
- Total Failed Requests 1xx & 3xx
- Total Failed Requests 4xx
- Total Failed Requests 5xx
Development: Optimizations
The dashboard displays basic information about CloudHub applications and On-Premise servers.
It is divided into CloudHub and On-Premise sections that shows:
- CPU used
- Memory used
- Network in and out
Datadog Mule Integration 4 APM
XML Reference | Update Span
Update Span
The Update Span element updates a span already created in the flow, adding tags to add more optional information between the creation and closure of it.
<flow name="datadog-connectorFlow" >
    <datadog-apm:update-span config-ref="Datadog_APM_Config" spanName="Span to be updated"/>
</flow>
Parameters
|
Name |
Type |
Description |
Default Value |
Required |
|---|---|---|---|---|
|
config-ref |
Configuration |
Global configuration element of the operation |
|
x |
|
spanName |
String |
Name of the span to be updated |
|
x |
Activate Span
The Activate Span element sets a span as the new active one, measuring all the current performance in the flow, contains the global configuration and the span name to be activated.
<flow name="datadog-connectorFlow" >
    <datadog-apm:activate-span config-ref="Datadog_APM_Config" spanName="Span to be activated"/>
</flow>
Parameters
|
Name |
Type |
Description |
Default Value |
Required |
|---|---|---|---|---|
|
config-ref |
Configuration |
Global configuration element of the operation |
|
x |
|
spanName |
String |
Name of the span to be activated |
|
x |
Finish All
The Finish All element sets all the spans created to finished at once, this operation is executed based on a LIFO structure, contains the Global configuration
<flow name="datadog-connectorFlow" >
    <datadog-apm:finish-all config-ref="Datadog_APM_Config"/>
</flow>
|
Name |
Type |
Description |
Default Value |
Required |
|---|---|---|---|---|
|
config-ref |
Configuration |
Global configuration element of the operation |
|
x |
Logger
The Logger element creates information to be logged to the stated span in the Span Name field, sending information that can be consulted in the Datadog APM view, contains the Global configuration, the span name, a message, the logging level to be chosen, and the category. This logger operation is designed to help correlating the produced log with the parent trace Id in Datadog APM.
<flow name="datadog-connectorFlow" >
    <datadog-apm:log config-ref="Datadog_APM_Config" spanName="span to be logged" message="message" category="category of the log" level="ERROR"/>
</flow>
|
Name |
Type |
Description |
Default Value |
Required |
|---|---|---|---|---|
|
config-ref |
Configuration |
Global configuration element of the operation |
|
x |
|
spanName |
String |
Name of the span in which the logs will be inserted |
|
x |
|
message |
String |
Message to be inserted in the span |
|
x |
|
level |
Enumeration, one of:
|
Logging level of the log |
INFO |
|
|
category |
String |
Label to classify the log |
|
|
Datadog Mule Integration 4 APM
Logging | Logs Forwarding
Logs forwarding in CloudHub
Configure the log4j2.xml file with the CloudHub appender.
<Appenders>
  <Log4J2CloudhubLogAppender name="CLOUDHUB"
        addressProvider="com.mulesoft.ch.logging.DefaultAggregatorAddressProvider"
        applicationContext="com.mulesoft.ch.logging.DefaultApplicationContext"
        appendRetryIntervalMs="${sys:logging.appendRetryInterval}"
        appendMaxAttempts="${sys:logging.appendMaxAttempts}"
        batchSendIntervalMs="${sys:logging.batchSendInterval}"
        batchMaxRecords="${sys:logging.batchMaxRecords}"
        memBufferMaxSize="${sys:logging.memBufferMaxSize}"
        journalMaxWriteBatchSize="${sys:logging.journalMaxBatchSize}"
        journalMaxFileSize="${sys:logging.journalMaxFileSize}"
        clientMaxPacketSize="${sys:logging.clientMaxPacketSize}"
        clientConnectTimeoutMs="${sys:logging.clientConnectTimeout}"
        clientSocketTimeoutMs="${sys:logging.clientSocketTimeout}"
        serverAddressPollIntervalMs="${sys:logging.serverAddressPollInterval}"
        serverHeartbeatSendIntervalMs="${sys:logging.serverHeartbeatSendIntervalMs}"
        statisticsPrintIntervalMs="${sys:logging.statisticsPrintIntervalMs}">

      <PatternLayout pattern="[%d{MM-dd HH:mm:ss}] %-5p %c{1} [%t]: %m%n"/>
  </Log4J2CloudhubLogAppender>
</Appenders>
When an application is deployed in CloudHub the Runtime Manager always overwrites the log4j2.xml Disable the CloudHub logs in order for Runtime Manager to apply the project’s log4j2.xml configuration file.
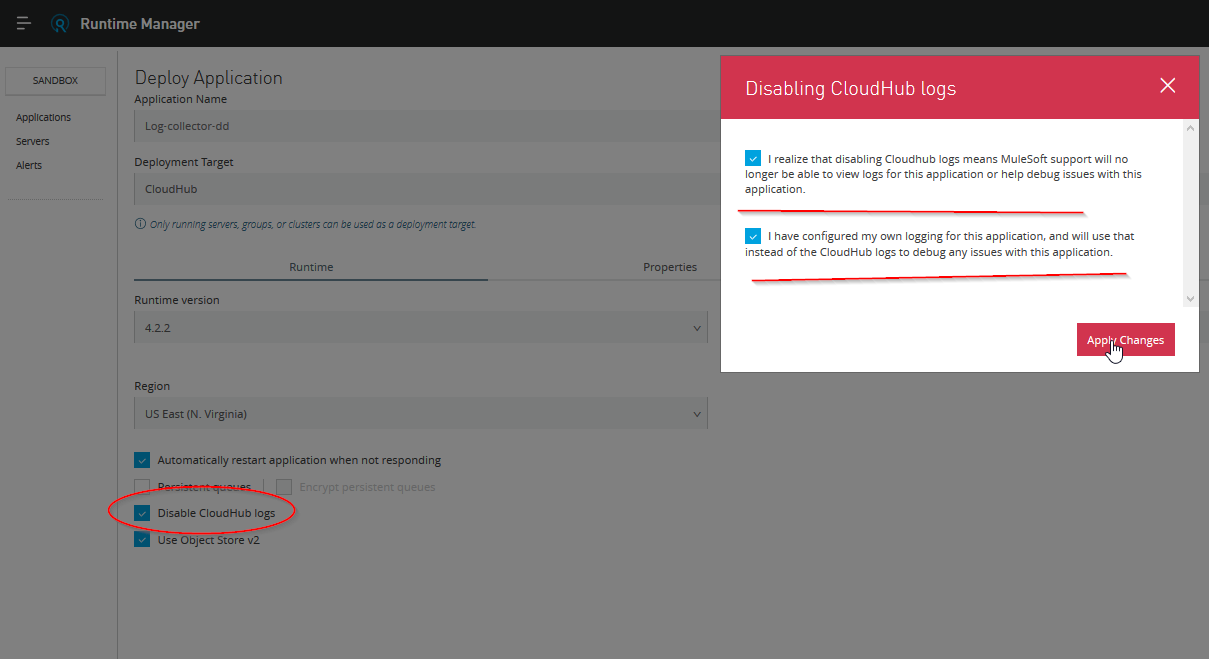
By default, Disable CloudHub logs is not a visible option in Runtime Manager. A special request to the Mulesoft support team is required to enable this option. More info: https://docs.mulesoft.com/runtime-manager/custom-log-appender
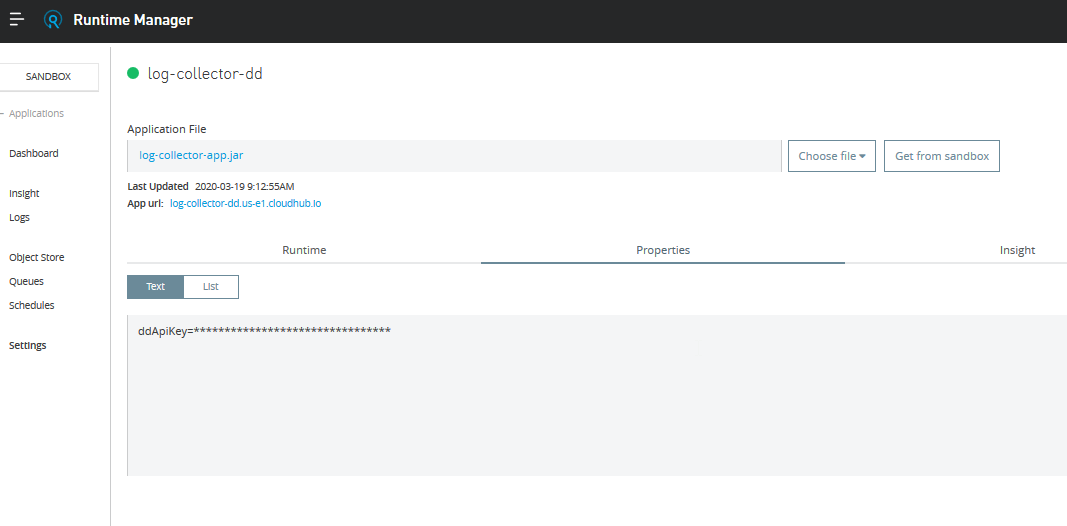
In order to deploy the app in CloudHub, add the ddkeyApi property. Because of security reasons, put in the mule-artifact.json ddApiKey as a secure property:
{
  "minMuleVersion": "4.3.0",
  "secureProperties": ["ddApiKey"]
}
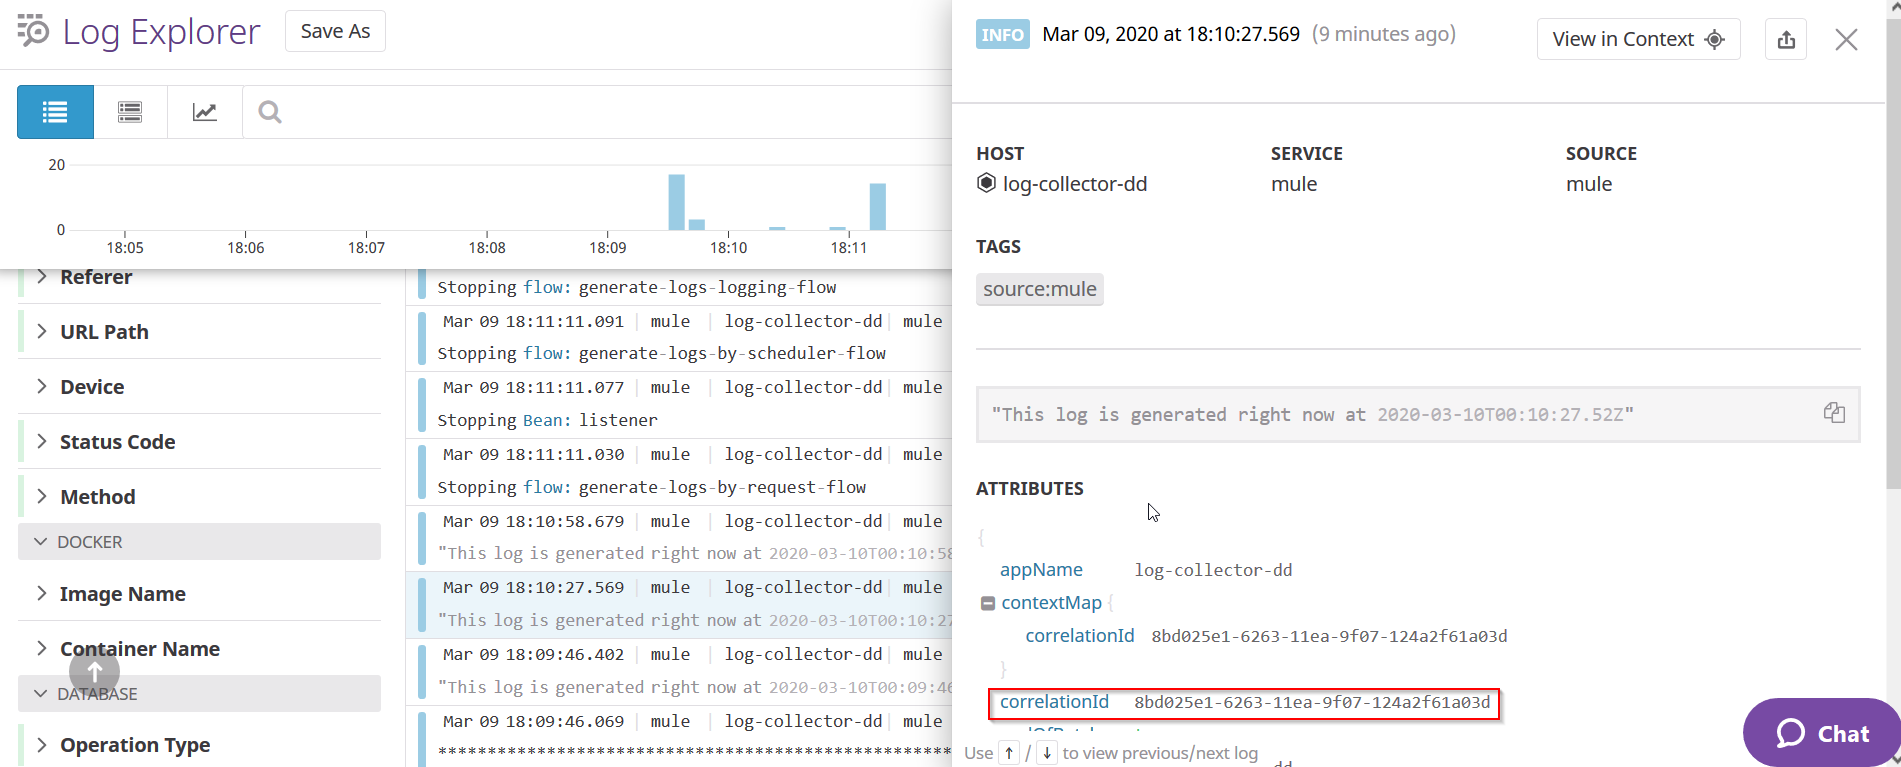
The logs shown in the live console are the logs generated by the log4j2.xml file.
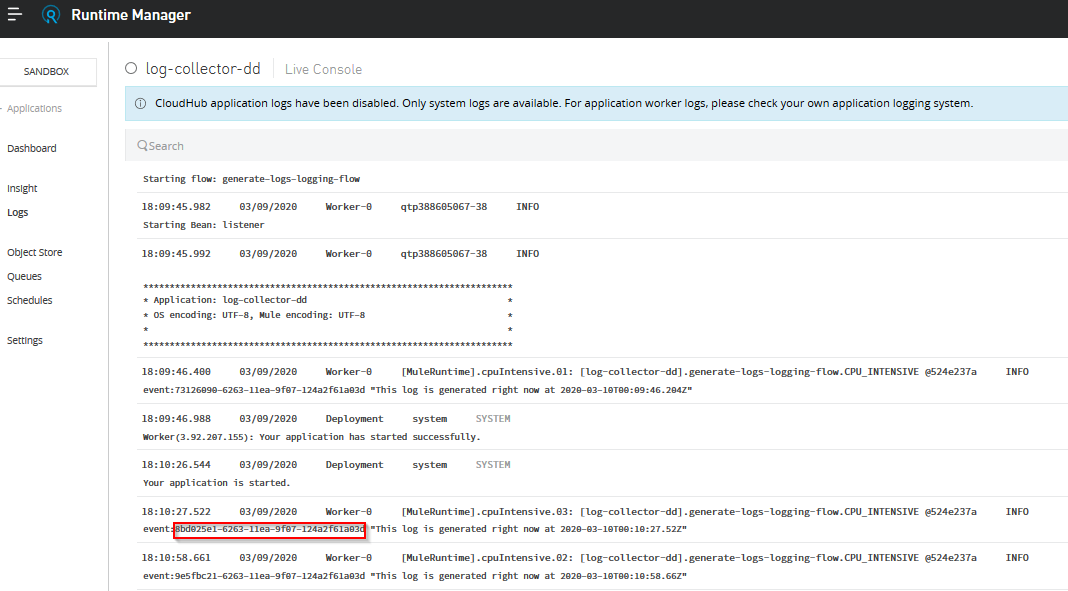
The same event Id can be seen in the log forwarded to Datadog Log.
Datadog Mule Integration 4 APM
Configuration and Operations | Span
Operations
Create Span
The create span operation as states, creates a new span in the flow, it will run in the flow until it gets finished. A span can contain Children, and those Children as well can contain Children and so on, this is useful to add granularity to the project.
The operation looks like this:
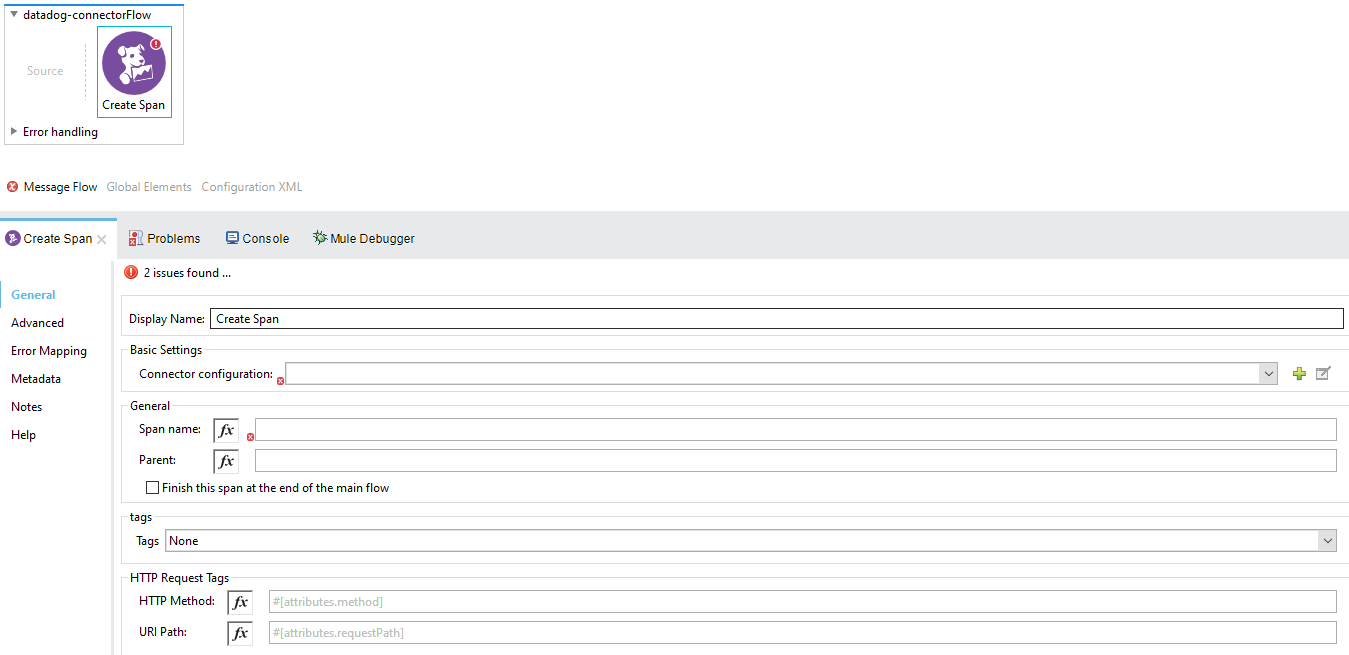
-
Display name: By default is displayed as Create Span.
-
Connector configuration: This is where the Datadog Global Configuration is set, required.
-
Span name: required.
-
Parent: The parent of the created span, optional.
-
Finish this span at the end of the main flow: This checkbox ensures that the span will be closed automatically at the end of the flow execution, the default is unchecked.
-
Tags: These are key-value pairs that can be set Inline or with Dataweave expressions, this provides labels attached to the spans that are created in execution time, optional.
-
HTTP Request Tags: Additional info the user can provide to the span, in this case the HTTP Method and the URI Path in case the user may require it for REST Services. Accept Dataweave expressions as well as static values. optional.
The following is an example of how to assign a child span to a parent. This flow will be used as the main example thoughout the different operation explanations. Let’s check how this can be useful.
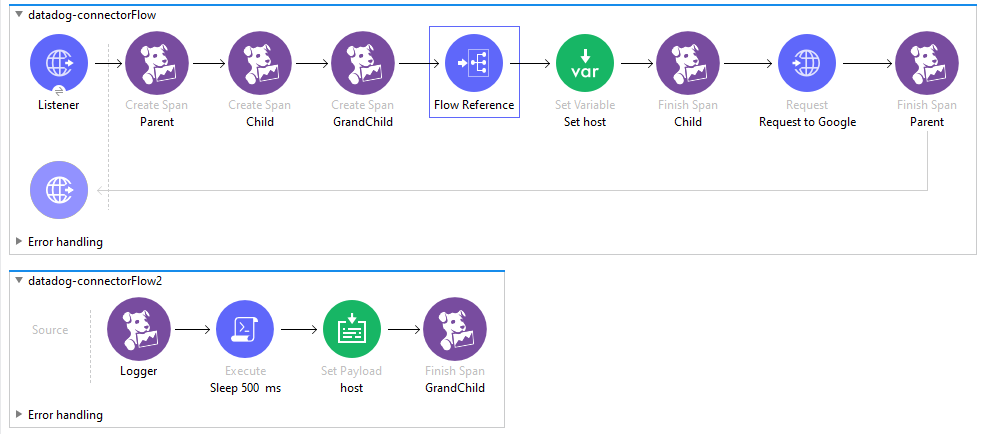
There are 3 spans created in the flow: Parent, Child, and GrandChild
The main span is called Parent, then in the Child span we assign the Parent field as Parent, which is the name of the first span created, and finally, we assign GrandChild span Parent field as Child.
With this we have the following hierarchy:
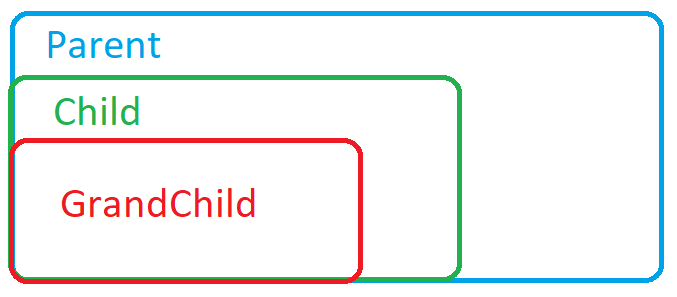
Parent will contain Child, at the same time Child will contain GrandChild.
If we run the following flow and go to the Datadog APM, the result is this trace:

And here the spans created:
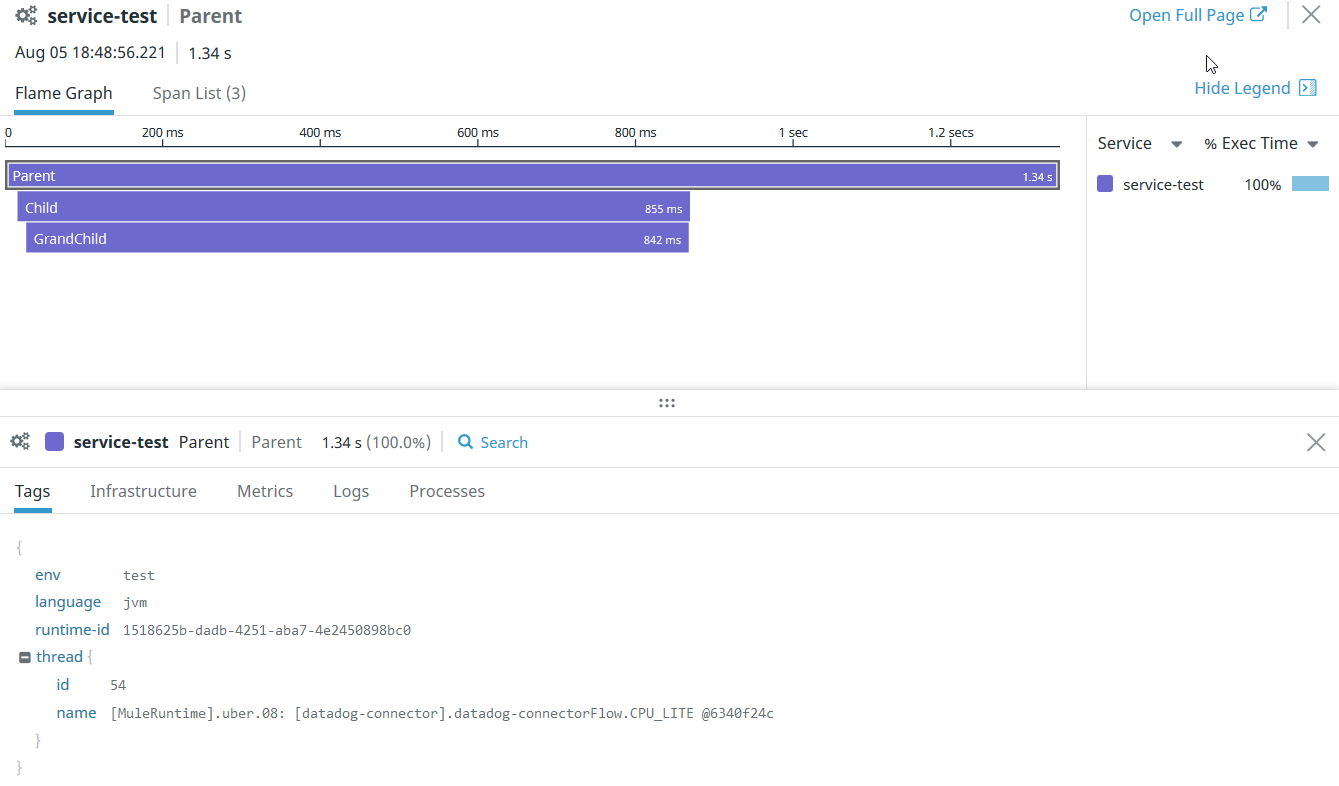
As you can see, Child and GrandChild are nested to the Parent. Nesting can have n level.
Datadog Mule Integration 4 APM
How to Installing
Installing a Run the sample tracing applications
Sections:
- Installing and execution
Getting the APIs required
Please download and import in Anypoint Studio each of the 4 APIs jars:
- Experience marketing-eapi https://cdn.ioconnectservices.com/cdn/docs/Datadog-APM-Connector/examples/datadog_apis/marketing-eapi-1.0.0.jar
- Process messaging-papi: https://cdn.ioconnectservices.com/cdn/docs/Datadog-APM-Connector/examples/datadog_apis/messaging-papi-1.0.0.jar
- System contacts-sapi: https://cdn.ioconnectservices.com/cdn/docs/Datadog-APM-Connector/examples/datadog_apis/contacts-sapi-1.0.0.jar
- System twilio-sapi: https://cdn.ioconnectservices.com/cdn/docs/Datadog-APM-Connector/examples/datadog_apis/twilio-sapi-1.0.0.jar
Exchange configurations
Once all the APIs have been downloaded, we need to set up some Exchange configurations.
1. Ensure you have the Datadog APM Connector publish as an asset in your company's Anypoint Platform Exchange.
2. For each one of the APIs imported, update the pom.xml file by replacing every {ORGANIZATION_ID} with your own Anypoint Platform organization ID.
3. In your local maven installation open your settings.xml file. Add your Anypoint Plataform username and password inside the "<servers>" tag. Your server ID in the settings.xml file needs to match exactly with your repository ID in the pom.xml file. You can skip this step if you already have it configured.
4. Anypoint Studio should be able to start downloading the connector from your company's Exchange into your projects. If not happening automatically, please make an update in your pom.xml file or close and reopen each project.
Preparing the run configurations
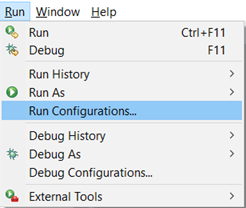
Once you have all 4 APIs projects imported, and configurations applied, go to Run > Run configurations...
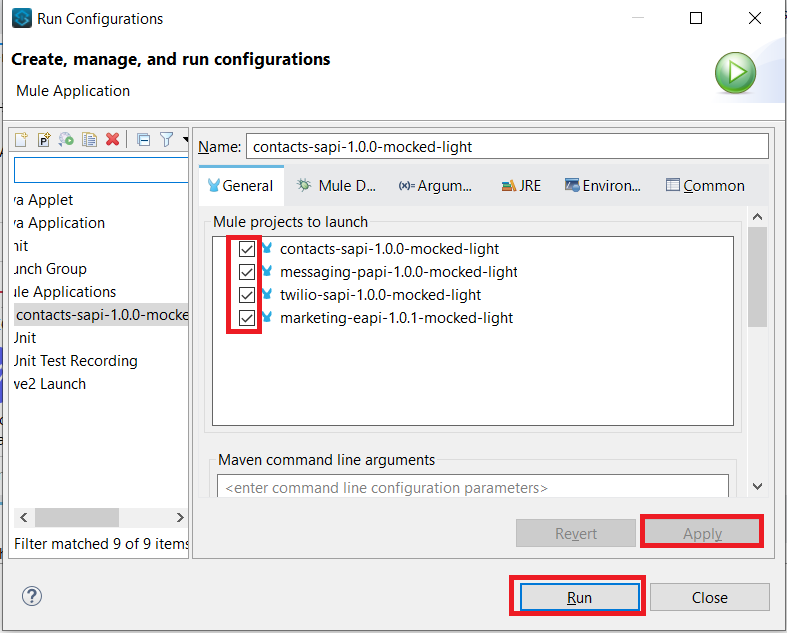
Select all projects to run them simultaneously.
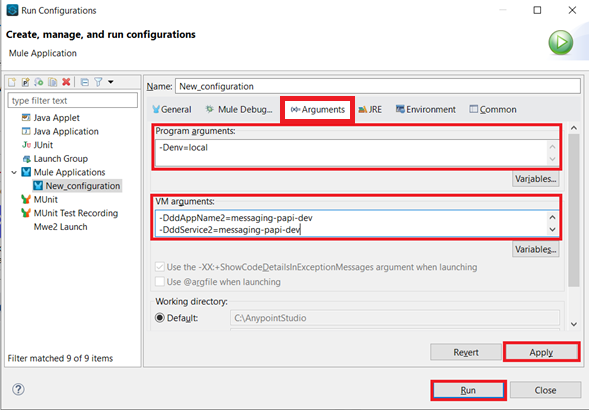
In the Arguments tab in the Program arguments box, put the following:
-Denv=local
In the VM Arguments box, put the following (and please replace dd.host and ddApiKey values with your own):
-Ddd.host={place here your host ip, sample: 127.0.0.1}
-DddApiKey={place here your api key sample: abcdefg123456}
-Ddomain=localhost
-DddAppName1=marketing-eapi-dev
-DddAppName2=messaging-papi-dev
-DddAppName3=contacts-sapi-dev
-DddAppName4=twilio-sapi-dev
-DddService1=marketing-eapi-dev
-DddService2=messaging-papi-dev
-DddService3=contacts-sapi-dev
-DddService4=twilio-sapi-dev
Execution of the APIs
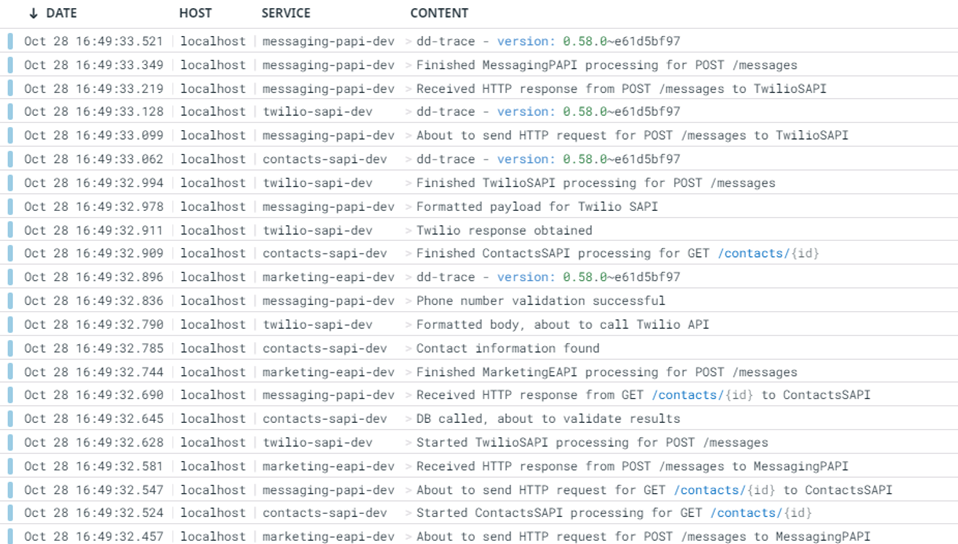
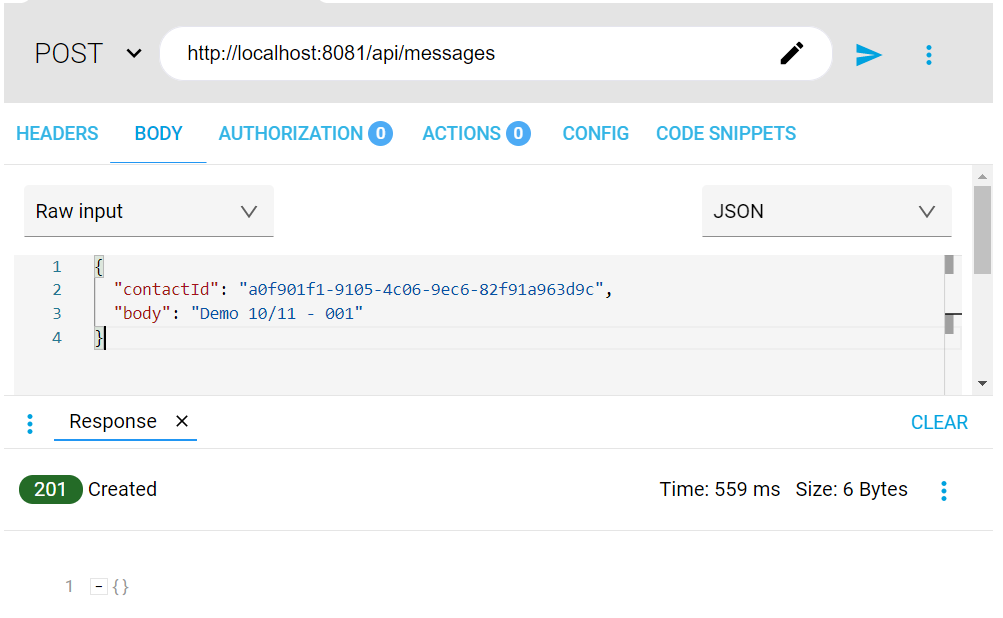
Once installed, use the following curl command to execute the APIs from the Marketing EAPI (please note, calls made by the example APIs shared in this page are just mocked calls).
curl --location --request POST 'http://localhost:8081/api/messages' \
--header 'Content-Type: application/json' \
--data-raw '{
  "contactId": "a0f901f1-9105-4c06-9ec6-82f91a963d9c",
  "body": "Demo 10/11 - 001"
}'
The Marketing EAPI should return an HTTP status code 201 as a successful response.
Now that the transaction has been executed, you should be able to track the event with the correlation ID in your Datadog instance, which is shared across all systems, in the Datadog > Logs section. Take the below image as a reference of what you would be able to find in your Datadog instance.