DATADOG MULE® INTEGRATION
OOTB Assets | Monitors
Monitors
Monitors help to constantly keep track of specific events, triggering an alert or notification whenever such events fulfill a condition. Datadog Mule® Integration comes with pre built-in monitors for events of failures in the Mule applications or servers.
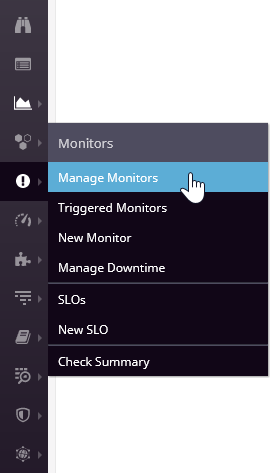
Go to the monitors list by clicking at the side bar:

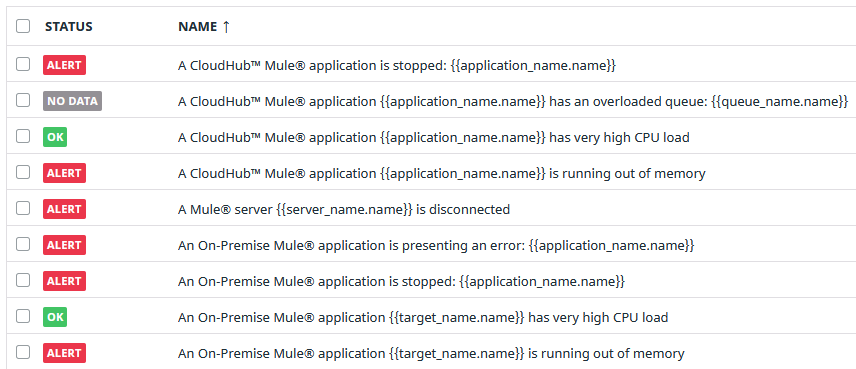
It should be a list like this one:

All monitors have the same structure, but each one is configured with specific metrics. The monitor is triggered based on thresholds already set.
If you open a monitor in the Edit section, you will find the alert threshold value defined by default. This is different for each monitor:

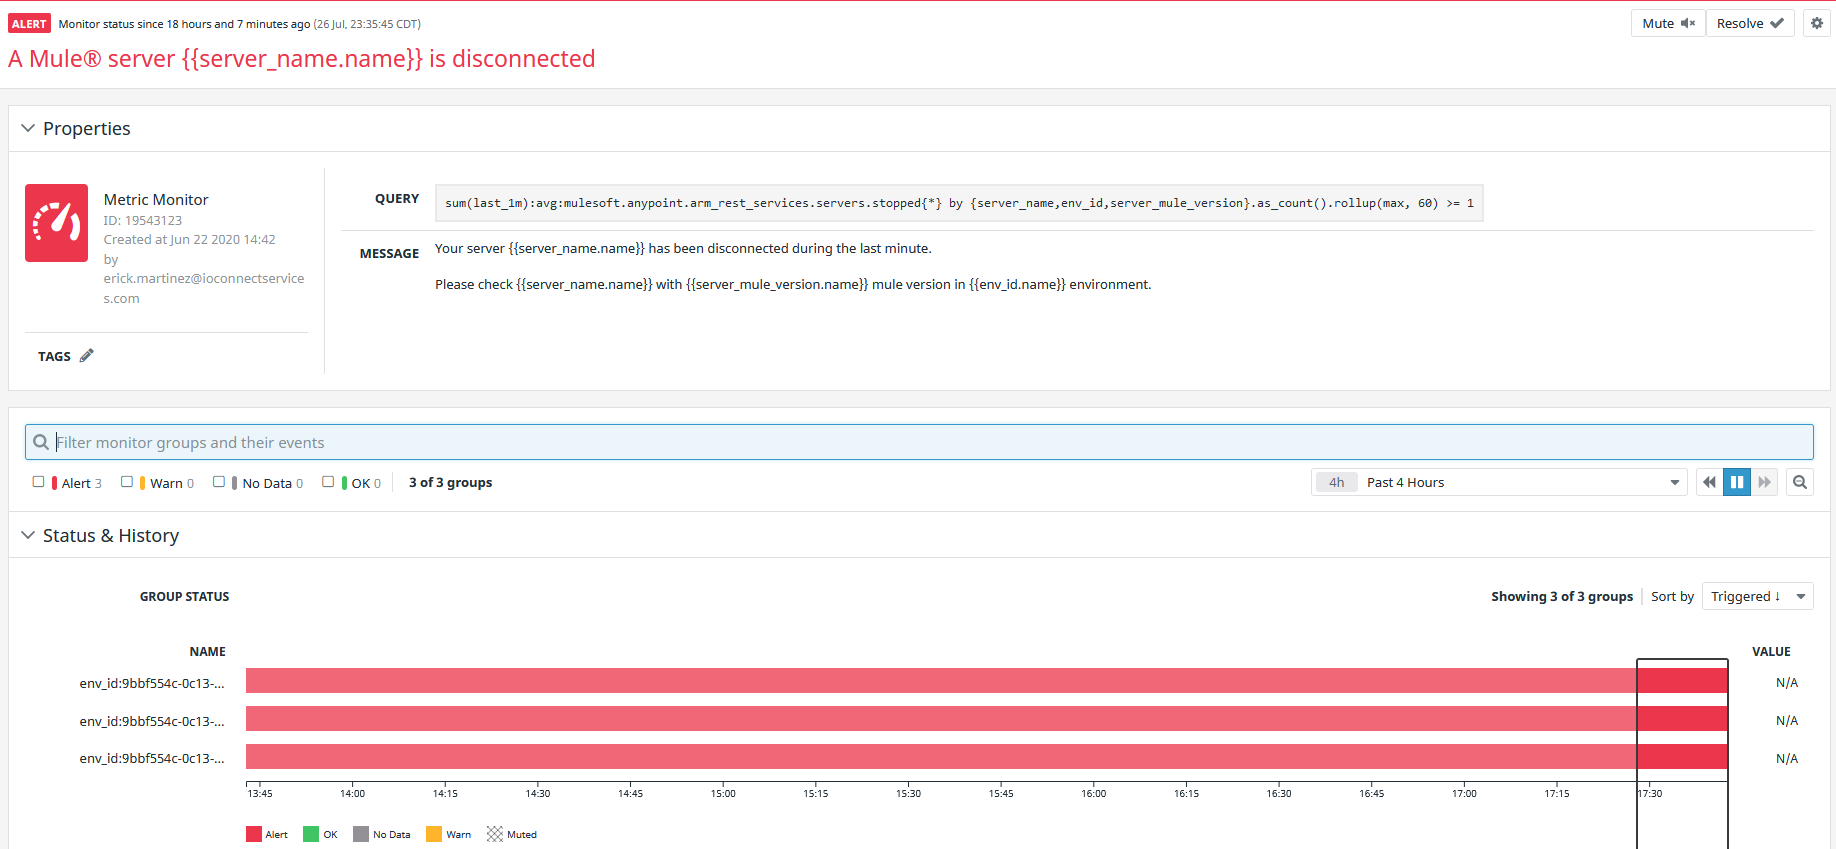
If the alert is triggered, the monitor is going to change to red color, like the image below:

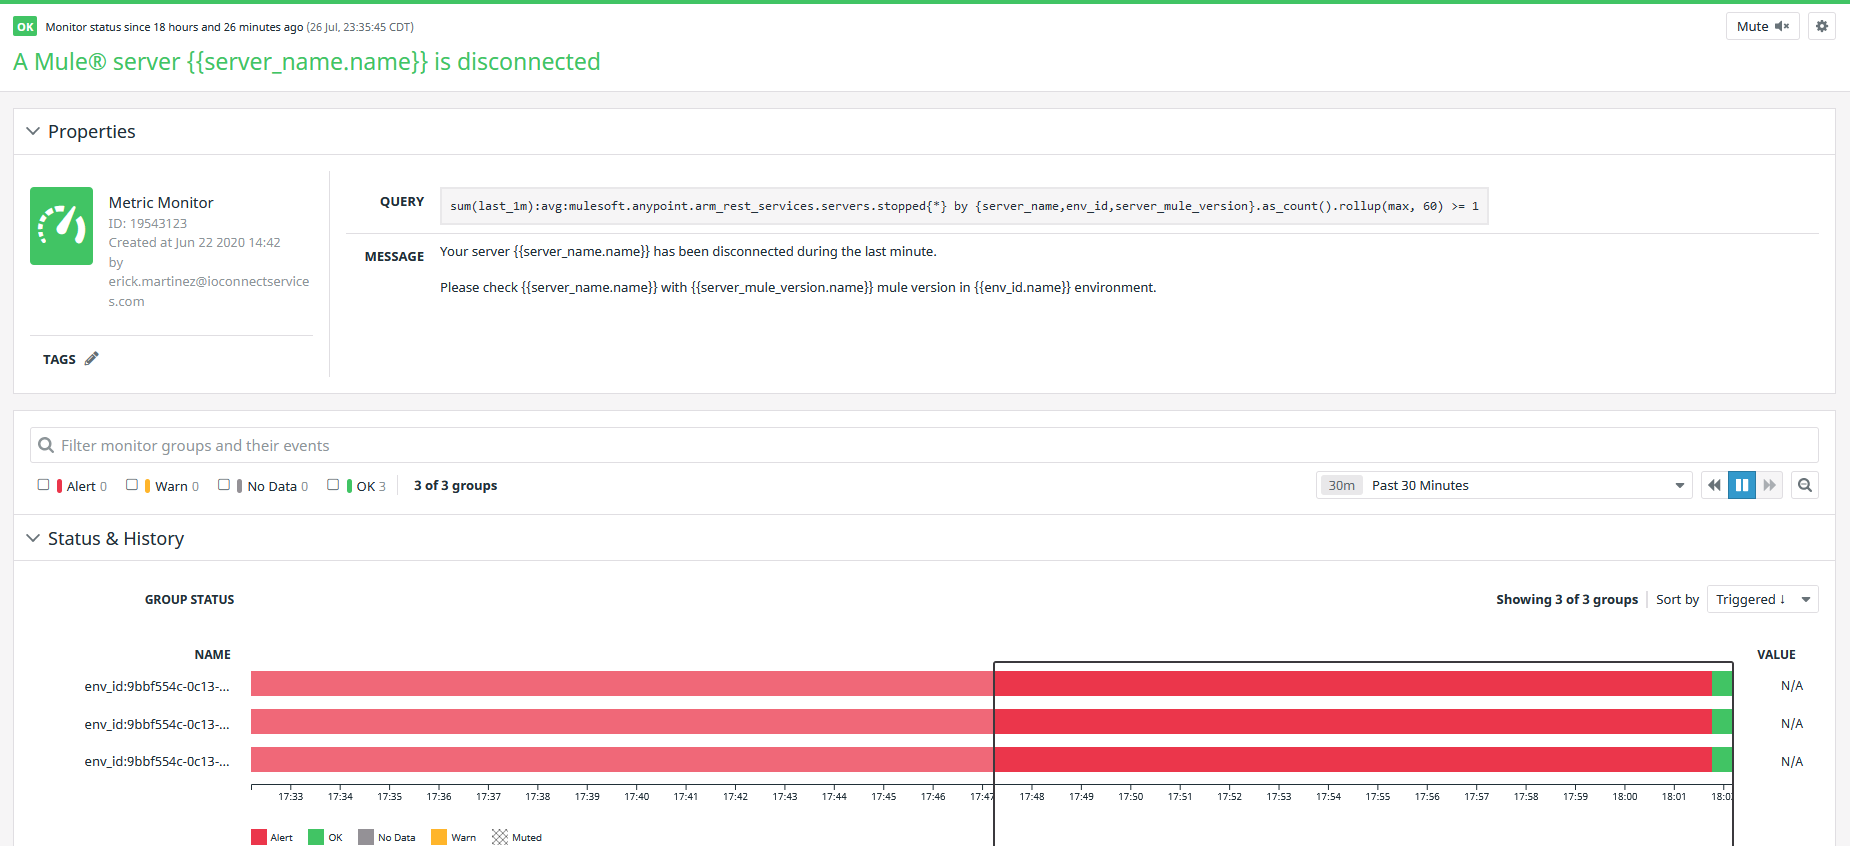
You can indicate in the monitor that the issue is fixed by clicking the Resolve button at the top-right corner, the Alert will change the status to OK and the color from red to green:

Once updated to “Resolve”, the Alert Monitor widget in the dashboards, also will be updated to OK status.

All alerts can be configured to trigger alerts. This is done by configuring the email address, Slack channel or other communication medium that is configured in your Datadog instance. Click on the “Edit” button on the monitor and scroll down to the Notify your team section and configure accordingly.
To learn more about monitors go to https://docs.datadoghq.com/monitors/