Datadog Mule Integration 4 APM
Datadog Config
Datadog Config
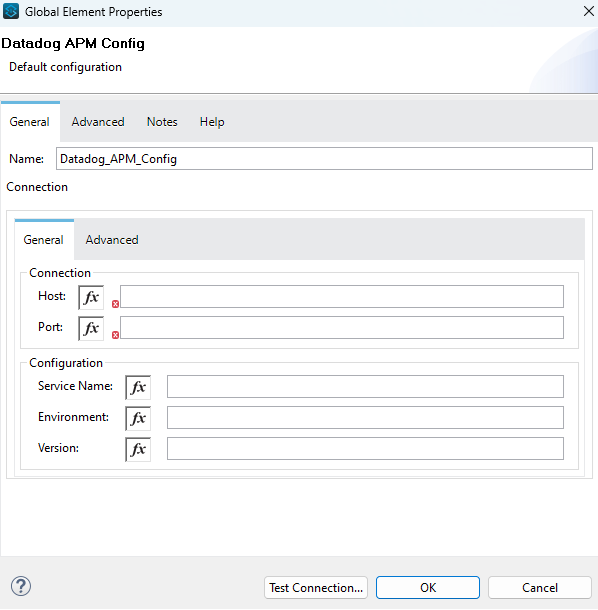
The Datadog APM Global Configuration organizes connection elements such as the host and port, also provides configuration parameters for optional config like the Service Name and the Environment.
<datadog-apm:config name="Datadog_APM_Config" >
    <datadog-apm:connection host="${host}" port="8126" environment="${env}" service="${service}"/>
</datadog-apm:config>
<datadog-apm:config name="Datadog_APM_Config" >
    <datadog-apm:connection host="${host}" port="8126" environment="${env}" service="${service}"/>
</datadog-apm:config>
Parameters
|
Name |
Type |
Description |
Default Value |
Required |
|---|---|---|---|---|
|
host |
String |
Host where the Datadog Instance is running |
|
x |
|
port |
int |
Port to connect to the Datadog instance |
|
x |
|
service |
String |
Service name to reference this execution |
unnamed-java-app |
|
|
environment |
String |
label to states the environment where the execution is running |
|
|
Datadog Mule Integration 4 APM
Run Configurations
Datadog Mule Integration 4 APM
Log4j
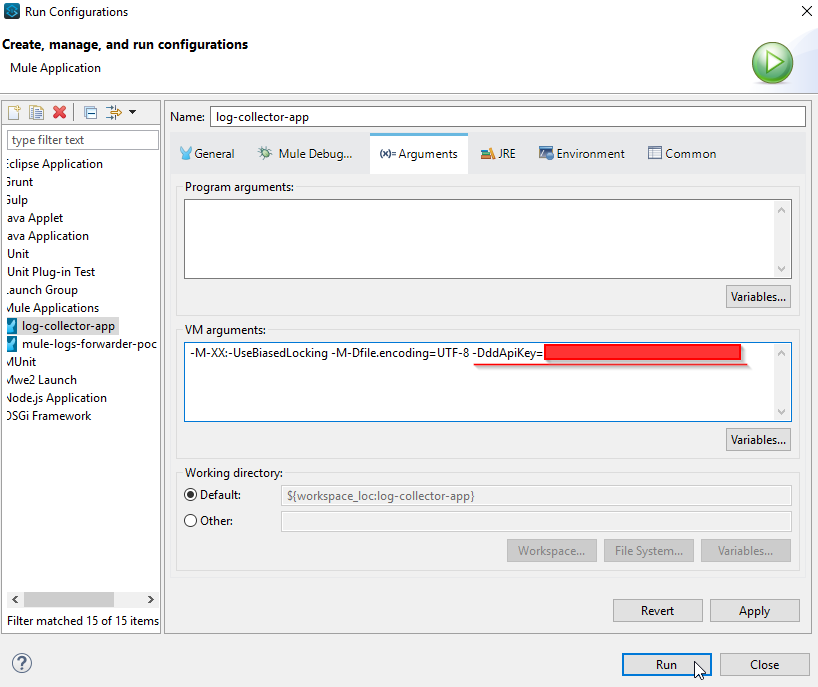
To use this operation, you need to configure the appended in the log4j2.xml file in your project as the below example. This will help to forward the logs captured in Log4J2 to the Datadog Log platform. Note that there's a system variable, ddApiKey, that is passed at runtime.
Tag Version: When you set the version property in your application, a version tag is added to all your traces. This helps correlate apps and identify errors.
The global configuration now includes a "version" property. This allows you to specify the version of your app, which will be visible in the Datadog platform.

<Http name="DD-HTTP" url="https://http-intake.logs.datadoghq.com/v1/input" verifyHostname="false" method="POST">
    <Property name="DD-API-KEY" value="${sys:ddApiKey}" />
    <JSONLayout compact="false" eventEol="true" properties="true" stacktraceAsString="true">
        <KeyValuePair key="host" value="${sys:domain}" />
        <KeyValuePair key="appName" value="${sys:domain}" />
        <KeyValuePair key="ddsource" value="mule" />
        <KeyValuePair key="service" value="mule" />
        <KeyValuePair key="correlationId" value="$${ctx:correlationId:-}"/>
        <KeyValuePair key="version" value="${sys:version}"/>
    </JSONLayout>
</Http>
In Studio, you can configure this variable as a VM argument.
Logs forwarding in CloudHub
Configure the log4j2.xml file with the CloudHub appender.
<Appenders>
  <Log4J2CloudhubLogAppender name="CLOUDHUB"
        addressProvider="com.mulesoft.ch.logging.DefaultAggregatorAddressProvider"
        applicationContext="com.mulesoft.ch.logging.DefaultApplicationContext"
        appendRetryIntervalMs="${sys:logging.appendRetryInterval}"
        appendMaxAttempts="${sys:logging.appendMaxAttempts}"
        batchSendIntervalMs="${sys:logging.batchSendInterval}"
        batchMaxRecords="${sys:logging.batchMaxRecords}"
        memBufferMaxSize="${sys:logging.memBufferMaxSize}"
        journalMaxWriteBatchSize="${sys:logging.journalMaxBatchSize}"
        journalMaxFileSize="${sys:logging.journalMaxFileSize}"
        clientMaxPacketSize="${sys:logging.clientMaxPacketSize}"
        clientConnectTimeoutMs="${sys:logging.clientConnectTimeout}"
        clientSocketTimeoutMs="${sys:logging.clientSocketTimeout}"
        serverAddressPollIntervalMs="${sys:logging.serverAddressPollInterval}"
        serverHeartbeatSendIntervalMs="${sys:logging.serverHeartbeatSendIntervalMs}"
        statisticsPrintIntervalMs="${sys:logging.statisticsPrintIntervalMs}">

      <PatternLayout pattern="[%d{MM-dd HH:mm:ss}] %-5p %c{1} [%t]: %m%n"/>
  </Log4J2CloudhubLogAppender>
</Appenders>
When an application is deployed in CloudHub the Runtime Manager always overwrites the log4j2.xml Disable the CloudHub logs in order for Runtime Manager to apply the project’s log4j2.xml configuration file.
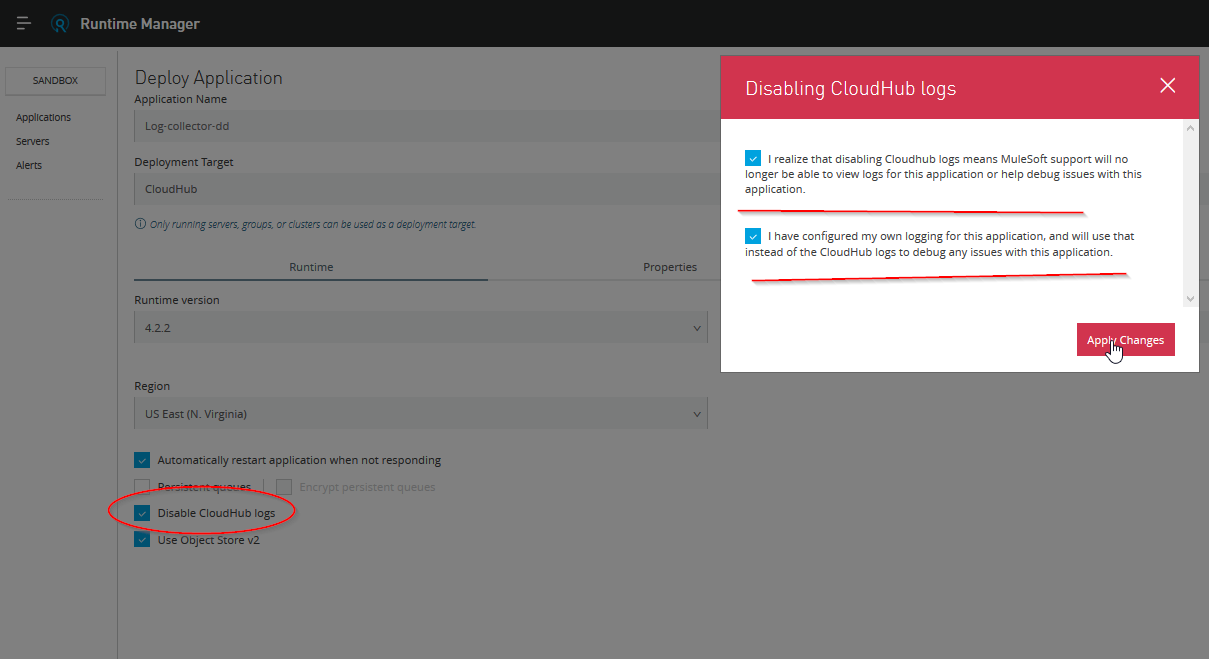
By default, Disable CloudHub logs is not a visible option in Runtime Manager. A special request to the Mulesoft support team is required to enable this option. More info: https://docs.mulesoft.com/runtime-manager/custom-log-appender
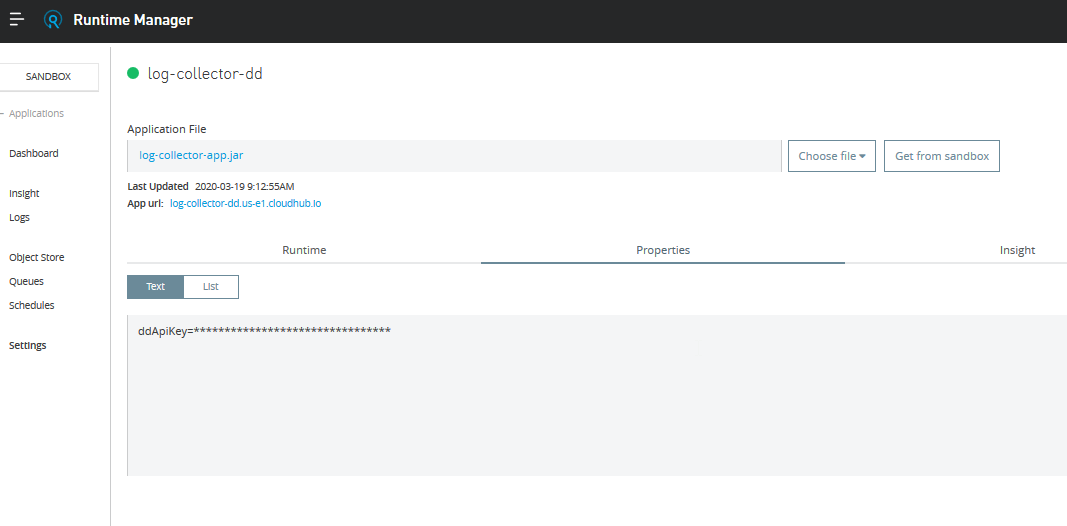
In order to deploy the app in CloudHub, add the ddkeyApi property. Because of security reasons, put in the mule-artifact.json ddApiKey as a secure property:
{
  "minMuleVersion": "4.3.0",
  "secureProperties": ["ddApiKey"]
}
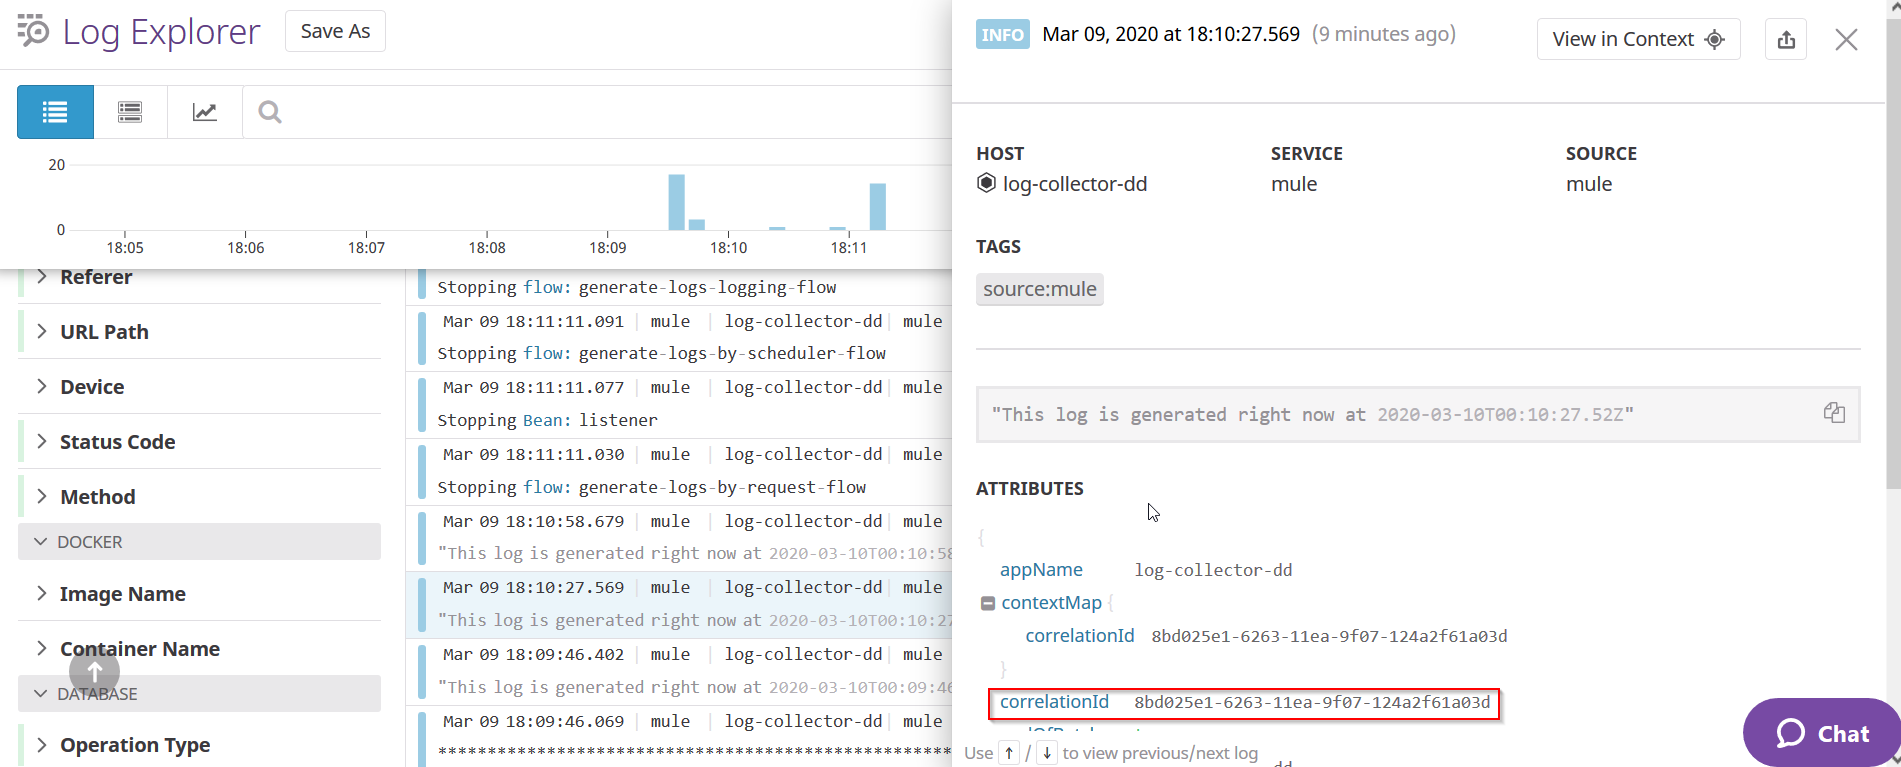
The logs shown in the live console are the logs generated by the log4j2.xml file.
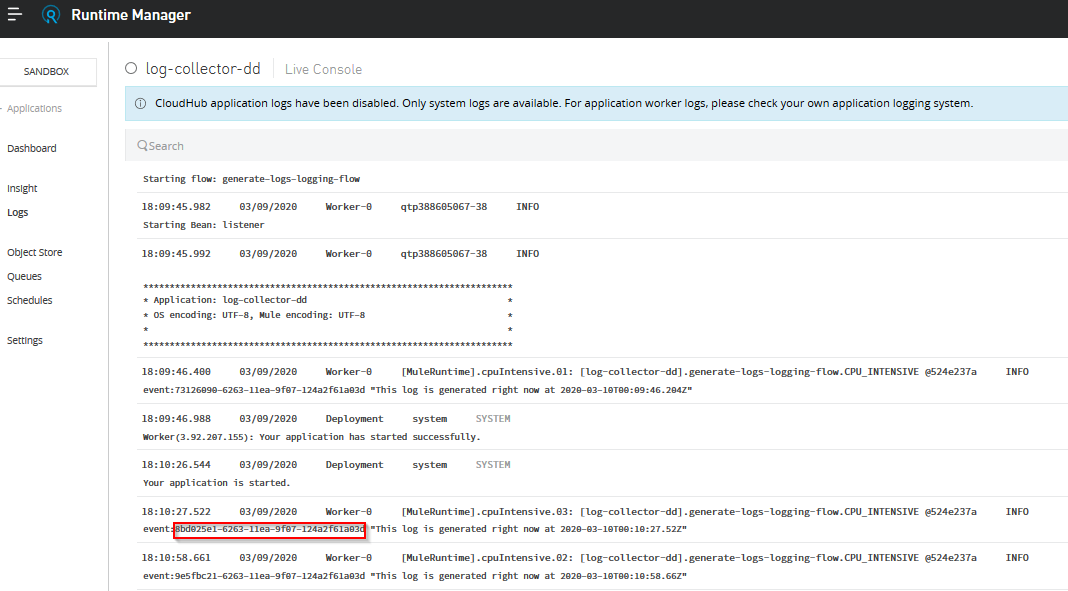
The same event Id can be seen in the log forwarded to Datadog Log.
Datadog Mule Integration 4 APM
Global Elements
Datadog APM Config
The Datadog APM Config is the global configuration of the Connector. It establishes the connection between the Mule application and the Datadog agent running APM.
-
These are the connection settings, here you set the host where the Datadog Agent is running, and the port.
-
These are optional information to give more context about the connection, by default the service name is unnamed-java-app, even if this field is empty.
-
Version: This allows you to specify the version of your app, which will be visible in the Datadog platform.
Datadog Mule Integration 4 APM
Datadog Integration
Introduction to Datadog Mule Integration 4 APM (DMI4APM)
Overview
The Datadog Mule Integration 4 APM (DMI4APM) enhances the monitoring capabilities of your Mule applications by seamlessly integrating with Datadog's APM system. Our solution extends the functionality of Datadog's APM connector by adding Mule-specific operations that encapsulate application flows. These operations not only capture and send trace data to Datadog APM but also facilitate the propagation of these traces across Mule applications and APIs.
Datadog APM Integration
Datadog's Application Performance Monitoring (APM) offers real-time insights into the performance of your applications, helping you track requests as they travel across different services and detect issues before they affect your customers. DMI4APM leverages this powerful feature to provide in-depth visibility into the health and performance of Mule applications.
Logs
DMI4APM ensures that all operational data is captured and logged, allowing for comprehensive traceability. The connector processes these traces, ensuring that the full journey of a request is visible in the Datadog APM interface, from the entry point in a Mule application to external services and back.
Mule Application Requirements
-
APM Mule Connector: Your Mule applications or APIs must have the APM Mule connector installed. This connector is vital for wrapping your application flows and enabling the propagation of trace data to the Datadog APM system. You can find it here.
-
Application Modifications: You will need to integrate Mule connector operations into your Mule applications or APIs. This step is essential for capturing the performance data that DMI4APM will process and send to Datadog.
Software Requirements
-
Java: Java 21 must be installed on your system, as DMI4APM requires it to run the necessary processes for APM data collection and integration.
-
Datadog Agent: A functioning Datadog Agent installation is required to facilitate the collection and forwarding of metrics and traces to the Datadog platform.
System and Network Requirements
-
Operating System: DMI4APM is compatible with both Linux and Windows operating systems, allowing you to choose the environment that best fits your infrastructure.
-
TCP Port: Ensure that TCP port 8127 is available and not being used by any other processes. DMI4APM uses this port to receive APM trace data, so it is crucial that this port is free to avoid any conflicts.
Important Notes
-
Verify that your system meets these requirements before proceeding with the installation.
-
Additional dependencies or configurations may be required depending on your specific system setup or the complexity of your Mule applications.
By meeting the above requirements, you can ensure that DMI4APM will function correctly within your Mule environment, providing you with comprehensive monitoring and improved performance insights.
System architecture
.png?VersionId=GXaqPHr.R1pU9AX7e.uYetpFEbLM84Hv)
Installation Guide for DMI4APM from the Datadog Marketplace
Before beginning the installation process for the Datadog Mule Integration 4 APM (DMI4APM), ensure that you have a Datadog account and that the Datadog Agent is installed and running on your system. The installation process outlined below is necessary to enable DMI4APM within your infrastructure, allowing you to start monitoring your Mule applications with Datadog's advanced APM capabilities.
Prerequisites
-
Datadog Account: Ensure you have an active Datadog account. If you do not have an account, you can sign up at the Datadog website.
-
Datadog Agent: The Datadog Agent must be installed and functioning on your system. For installation instructions, refer to the official Datadog Agent documentation.
-
System Compatibility: Verify that your system meets all the necessary requirements as described in the previous sections, including software, system, and network requirements.
-
Connected App: DMI4APM requires an Anypoint Platform connected app to validate there is an active Mule license. At the level of the Anypoint Platform master organization, create a connected app as "App acts on its own behalf - client credentials" and assign the "View Organization" permission.
Installation Steps
Once you have met all the prerequisites, follow these steps to install DMI4APM from the Datadog Marketplace:
Note: This steps must be executed as a standard user. Use root privileges only with specific sudo commands.
-
Open a Terminal or Command Prompt: Access your terminal or command prompt on the system where the Datadog Agent is installed.
-
Run the Installation Command: Enter and execute the following command to install the DMI4APM integration:
sudo -u dd-agent datadog-agent integration install --third-party datadog-iocs-dmi4apm==X.Y.Z
This command installs the DMI4APM version X.Y.Z as a third-party integration within your Datadog Agent environment.
Next Steps
After successfully installing DMI4APM, proceed with the configuration guide to set up and customize DMI4APM according to your monitoring needs. This includes setting up initial configuration settings, instances, and key configuration elements as detailed in the previous sections.
By following these steps and ensuring your system meets all requirements, you can leverage DMI4APM for comprehensive monitoring and improved performance insights within your Mule environment.
Configuration Guide for Datadog Mule Integration 4 APM (DMI4APM)
DMI4APM requires specific configuration settings to ensure successful integration with the Datadog platform and the Mule applications. Below is a guide to help you configure DMI4APM with the initial settings necessary for the Datadog integration.
Configuration Settings
Begin by setting the initial configuration for your integration with Datadog. This involves specifying the client_id and client_secret provided by Mule, as well as the dd_api_key, which is your unique Datadog API key.
These configuration settings will be provided in the conf.yaml file, which can be found in at /etc/datadog-agent/conf.d/iocs_dmi4apm.d/
# Initial configuration settings for the Datadog integration
init_config:
client_id: "<YOUR_MULE_CLIENT_ID>"
client_secret: "<YOUR_MULE_CLIENT_SECRET>"
dd_api_key: "<YOUR_DATADOG_API_KEY>"
Replace <YOUR_MULE_CLIENT_ID>, <YOUR_MULE_CLIENT_SECRET>, and <YOUR_DATADOG_API_KEY> with the credentials provided to you by Mule and Datadog.
Next, configure the instances and set the parameters for collection intervals, buffer sizes, tracer ports, and server ports. Here is an example configuration:
instances:
- min_collection_interval: 15
tracer:
source:
port: 8127
destination:
port: 8126
vm_options:
- "-Xmx128m"
Key Configuration Elements
-
min_collection_interval: The minimum interval between data collections, in seconds.
-
tracer:
-
source.port: The port where DMI4APM listens for incoming trace data (8127 by default).
-
destination.port: The port to which DMI4APM forwards the trace data (8126 by default).
-
vm_options: JVM options for running DMI4APM, such as memory limits.
Applying the Configuration
To apply these settings, insert them into the appropriate configuration file for DMI4APM, typically named conf.yaml or similar this has to be save in the following folder.
Linux:
/etc/datadog-agent/conf.d/iocs_dmi4apm.d
Windows:
C:\ProgramData\Datadog\conf.d\iocs_dmi4apm.d
After updating the configuration file with your specific values, restart DMI4APM to apply the changes.
Important Notes
-
Always keep your client_id, client_secret, and dd_api_key secure and do not share them publicly.
-
Adjust the buffer size and time limit settings based on the volume of your trace data and network conditions.
-
The VM options should be set according to the available system resources and the needs of your application.
By following this guide and correctly applying the configuration settings, you will establish a robust connection between your Mule applications and Datadog's monitoring services.
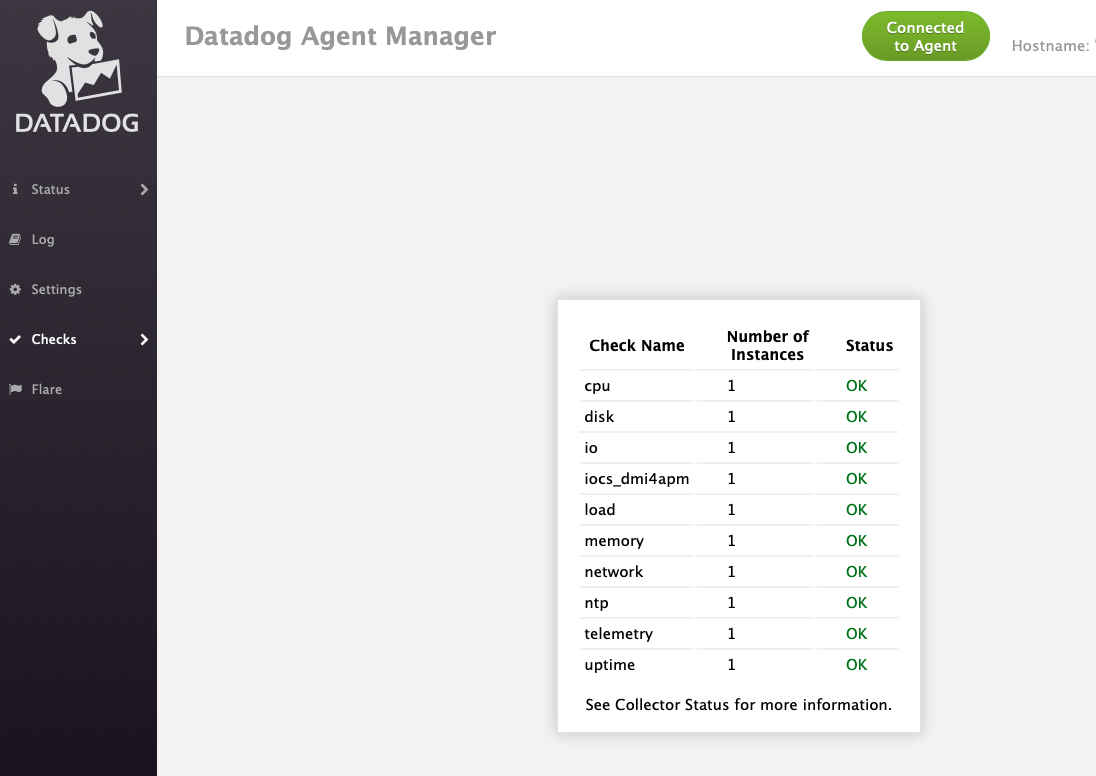
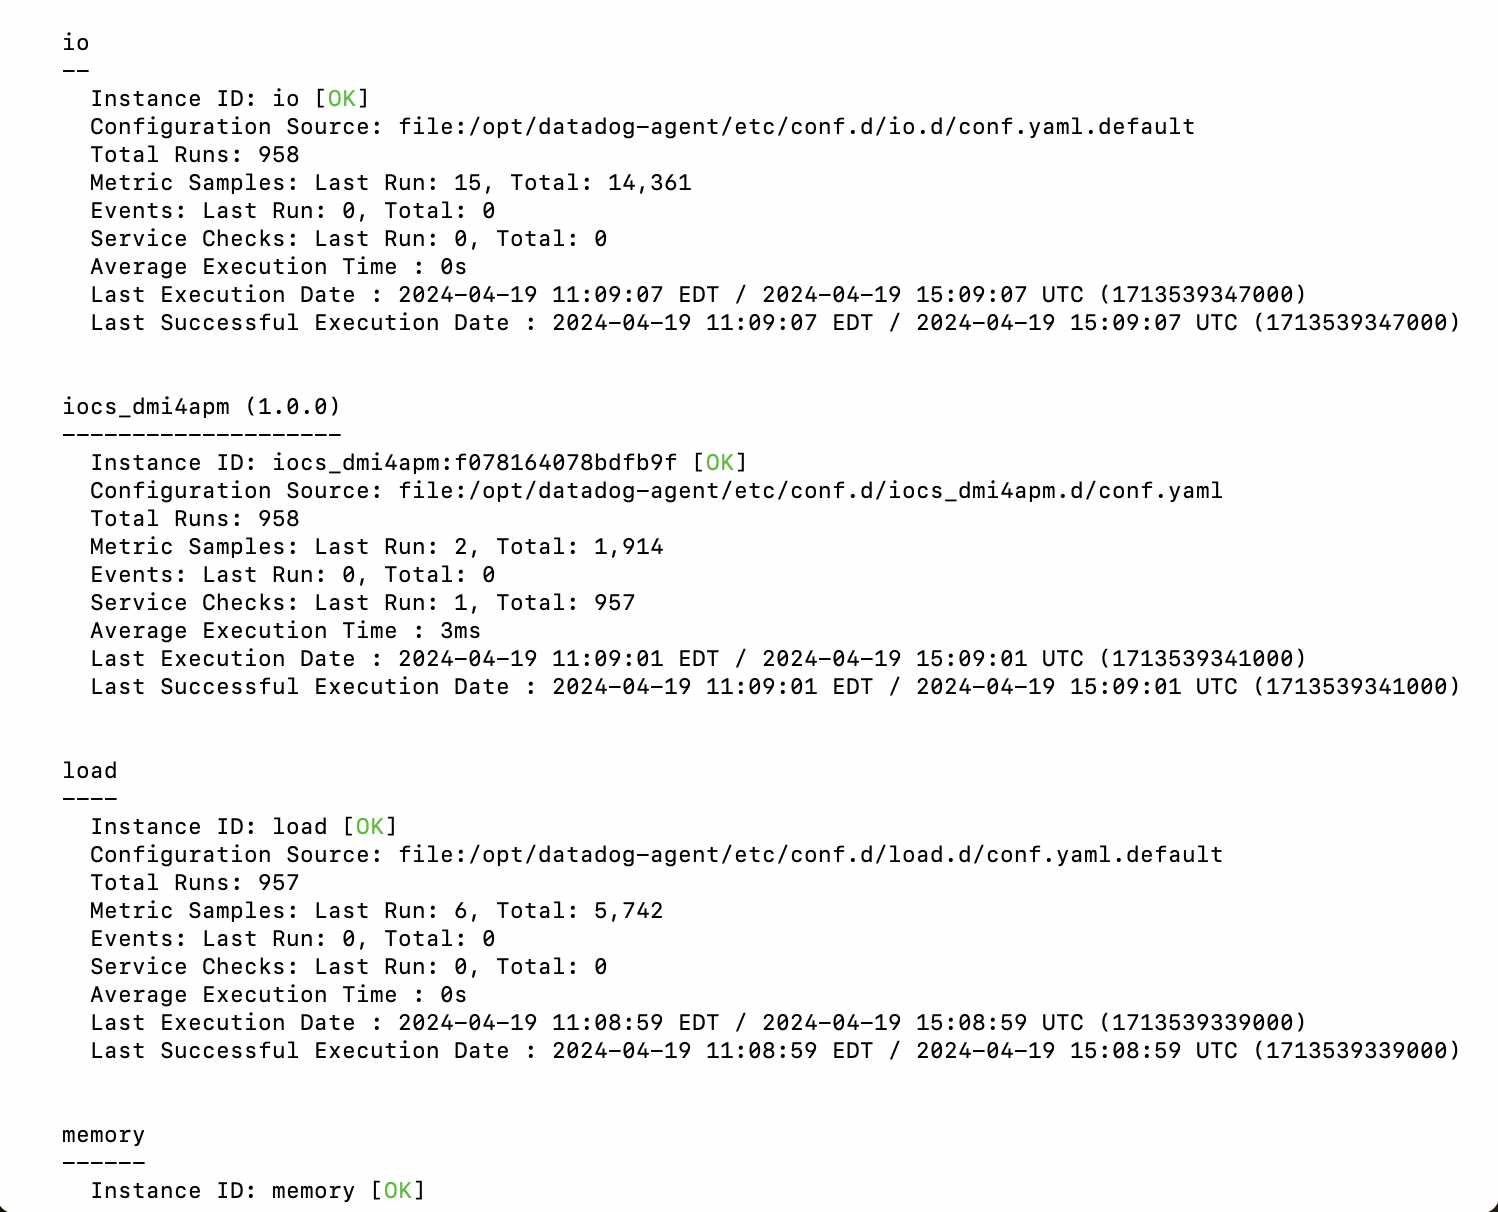
Verification: After the installation completes, verify that DMI4APM has been installed successfully by checking the Datadog Agent's status. You can do this by running:
sudo -u dd-agent datadog-agent status
Look for datadog-iocs-dmi4apm in the list of installed integrations to confirm that the installation was successful.
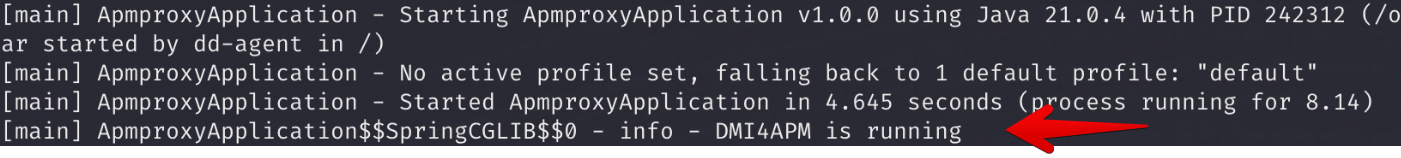
To confirm if the DMI4APM integration is running, follow these steps:
-
Navigate to the log directory by using the following path: /var/log/datadog
-
Display the content of the
apm.logfile. -
Check the log output for the following message to verify that the integration is running:
DATADOG MULE® INTEGRATION
RTF Operations
Operations: RTF Infrastructure
This dashboard is divided into three main sections that provides a view of your Runtime fabric applications infrastructure’s health and performance.
Section 1. CRITICAL
Contains applications with critical status:
- Stopped applications: Applications that are not running.
- Clusters degraded: Clusters that are experiencing performance issues.
- Clusters disconnected: Clusters that are unable to communicate.
- Nodes with status not healthy
- Nodes with status not ready
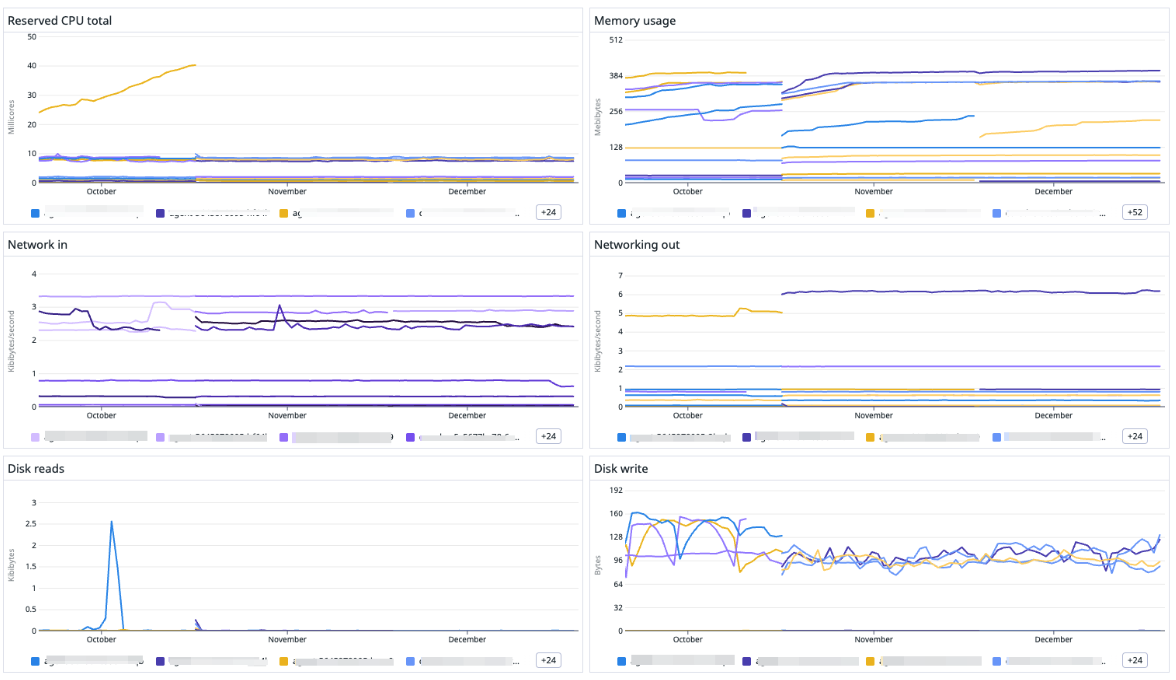
Section 2. APPLICATION RESOURCES OVERVIEW BY REPLICAS
Analyze CPU and memory metrics to ensure efficient resource utilization, to ensure resource utilization. Track storage access, network activity, data read/write operations.
Pro tip:
Configure the MuleSoft application variable to analyze resource for each replica used by the application variable.
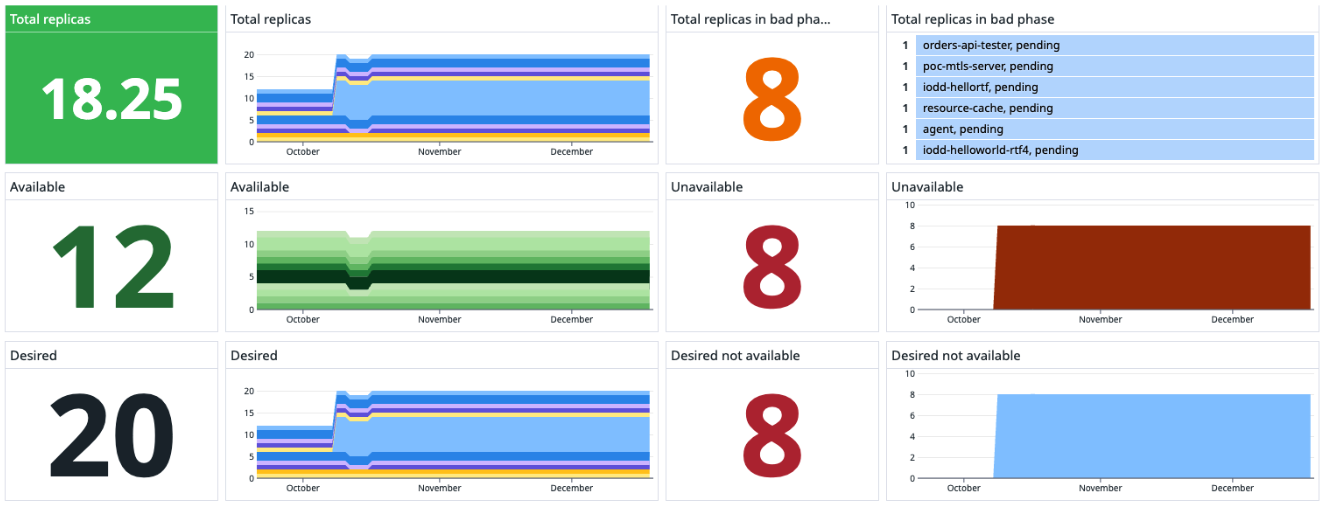
Section 3. REPLICAS OVERVIEW
This section provides a comprehensive view of your application's replicas, high availability, and resilience. Metrics include:
- Total replicas: The total number of replicas currently running.
- Replicas in bad phase: Replicas experiencing issues.
- Available vs. unavailable replicas: A quick glance at replicas currently serving traffic vs. those that are not.
- Desired replicas: The count of replicas you aim to have up and running.
- Desired not available: Difference between the desired and actual number of replicas, indicating potential deployment issues.
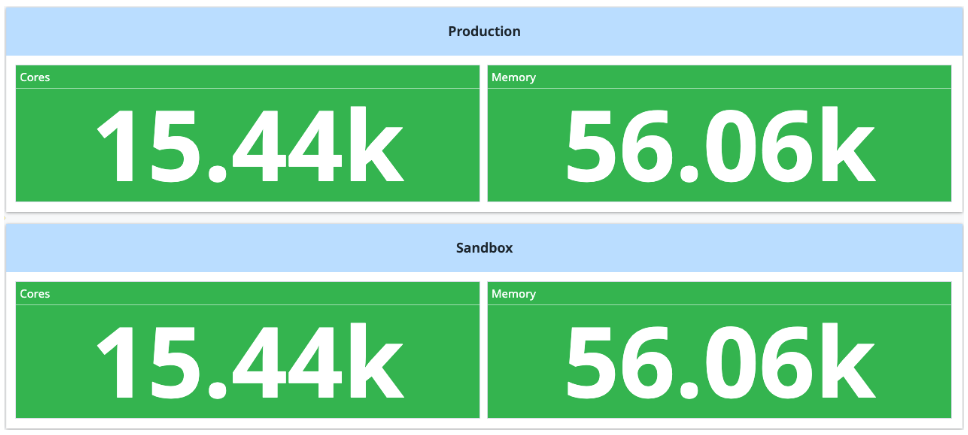
Operations: RTF Resource allocation and usage
This dashboard displays the resources consumed by your applications per environment, providing valuable insights into resource utilization. It is divided into three sections:
Pro-tip:
Configure the MuleSoft environment identifiers (production Environment and sandbox Environment) and save the view. See how you can obtain the identifiers and save the view in the Datadog dashboard in the pre-requisites.
Section 1. Environment resources
Shows the total cores and memory used by applications in production and sandbox environment.
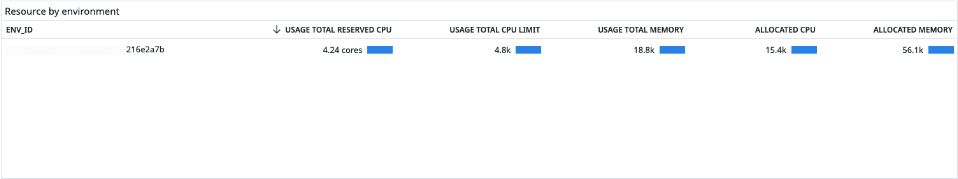
Section 2. Environment details
This table categorizes resources by environment:
- Usage total reserved CPU.
- Usage total CPU limit.
- Usage total memory.
- Allocated CPU.
- Allocated memory.
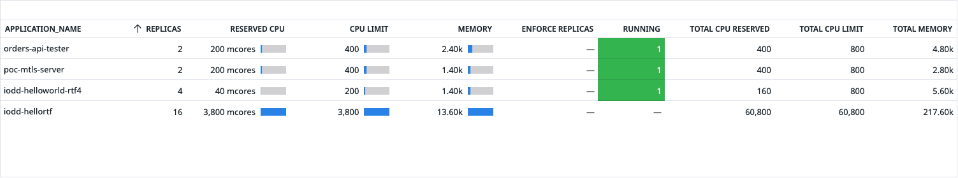
Section 3. Environment application resources
Focuses on resources from RTF (Runtime Fabric) applications.
- Replicas
- Reserved CPU
- CPU limit
- Memory
- Enforced active replicas
- Running
- Total CPU reserved
- Total CPU limit
- Total memory
SUPPORT
Modifying api_events.json
Last update:
October 04, 2023
Location of the File
The api_events.json file is located in the following directory path, relative to your Datadog installation directory:
$DD_INSTALLATION_DIR/datadog_checks/mulesoft_anypoint/vendor/integration_core/readers/mulesoft_anypoint/apis/api_events.json
Here, $DD_INSTALLATION_DIR represents the root directory of your Datadog installation.
Purpose of the File
The api_events.json file contains configuration data related to the metrics and events that the Mulesoft Anypoint Integration fetches. Each metric may have associated tags, one of which is resource_path.
How to Modify the File
-
Backup: As a best practice, always make a backup of the original api_events.json file before making any modifications. This ensures you have a fallback option in case of unintended changes.
-
Access the file: Navigate to the directory provided above, relative to your Datadog installation directory. Open the api_events.json file in a text or code editor of your choice.
-
Locate the "resource_path" tag: Within the file, search for instances of the tag "resource_path" under the tags_expr_str section for each metric. It will look something like this:
"resource_path": "$[*].['Resource Path']",
-
Remove the tag: For each metric that contains the "resource_path" tag, remove the entire line for this tag. Ensure you also handle the comma appropriately to maintain the correct JSON format.
-
Save and close: Once you've removed the "resource_path" tag from all metrics, save your changes and close the editor.
-
Restart the Datadog Agent: Depending on your configuration and setup, you might need to restart the Datadog Agent to apply the changes. Please refer to Datadog's official documentation or your system's best practices for guidance on this step.
Important Note:
🚨 Implications of Tag Removal: By removing the "resource_path" tag, if any dashboard or query uses this tag, it will be affected. The dashboard or query relying on this tag will no longer function as intended.
🚨 Maintaining JSON Structure: Ensure that the resulting api_events.json file maintains a valid JSON structure after the modification. Invalid or corrupted JSON can lead to malfunctions or loss of functionality in the Datadog Mulesoft Anypoint integration. Using online JSON validators or built-in features of JSON editors can help verify the structure.
Datadog Mule Integration 4 APM
Dashboards
The Datadog APM connector for Mule 4 applications helps to instrument Mule 4 applications either running on CloudHub or on-premises. By instrumenting the applications, you can measure the performance for each event going through the Mule flows. Please refer here for more information about Datadog APM, traces and spans.
Use the Datadog Connector for Mule 4 with Datadog APM tracing to gain visibility using the out-of-the-box performance dashboards.
Measure the performance of the operations in your flows as granular as needed using spans.
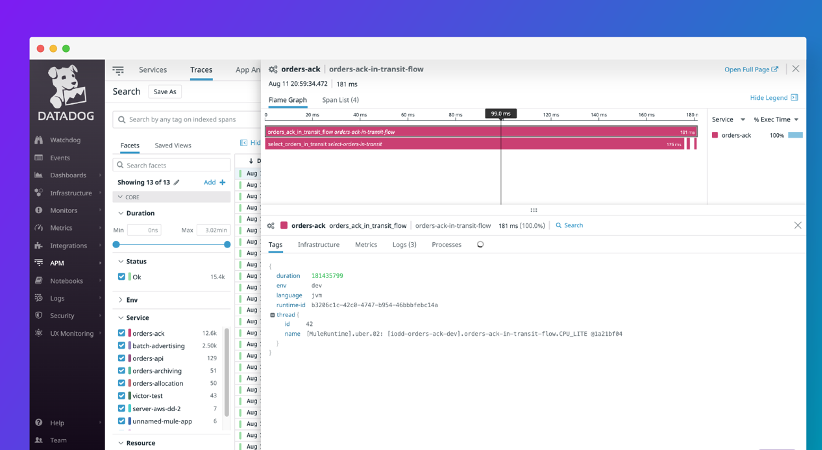
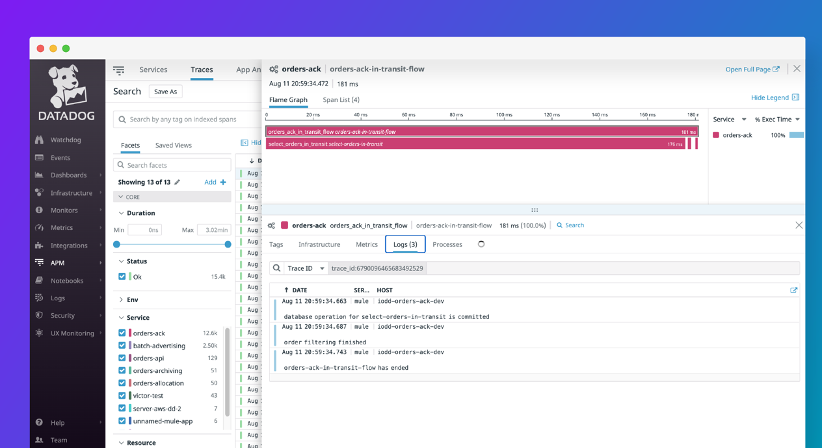
Also, correlate the logs generated within a transaction in a single trace to narrow down any performance optimization or troubleshooting scope.
DATADOG MULE® INTEGRATION
JMX [On-Prem] | Visualizing
Visualizing the JMX metrics
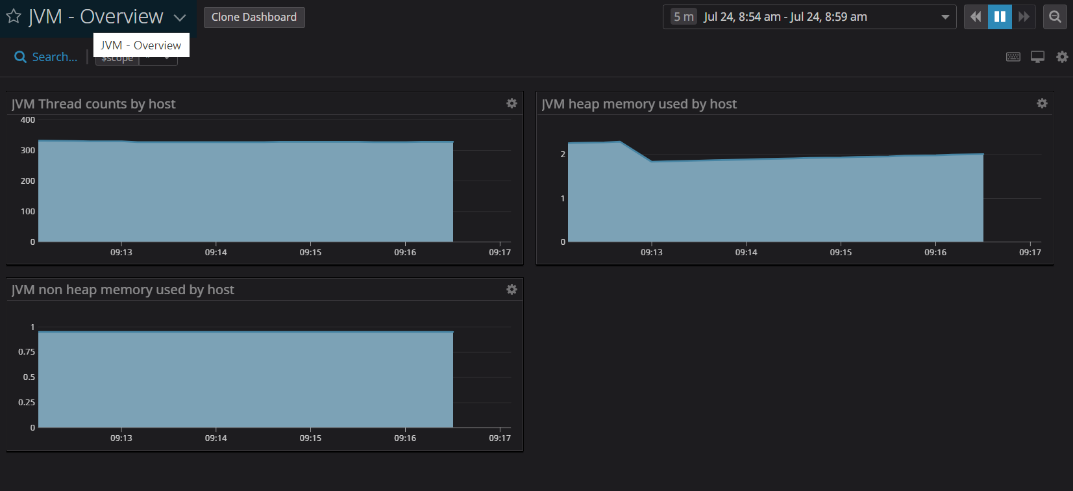
Now, let's confirm you are able to see the metrics in Datadog web page. Login into: https://app.datadoghq.com/account/login?next=%2F
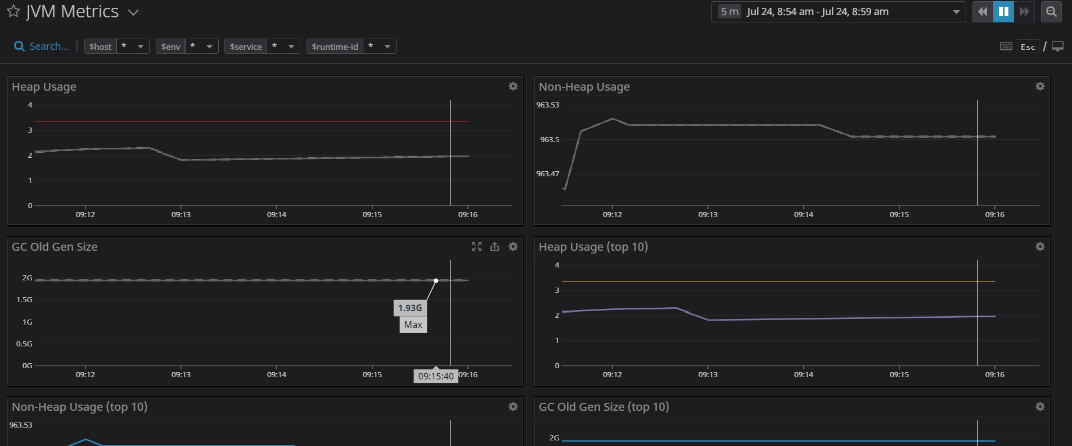
·Once there, go to the left menu, select Dashboards and there, look for JVM Metrics or JVM - Overview dashboard.
o If the JVM Metrics dashboard is selected, then go up into the dashboard, below the dashboard name, and check for the $host variable, here select your host or “*” to show hosts gathered metrics.
o If the JVM - Overview dashboard is selected, then go up into the dashboard, below the dashboard name, and check for the $scope variable, here select your host or “*” to show hosts gathered metrics.
o Please find below an image of what it is depicted above:
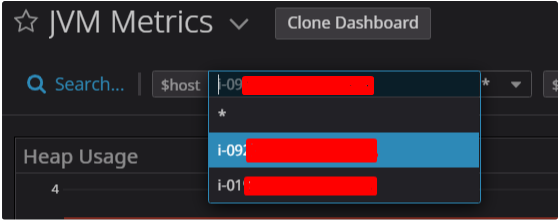
·And that’s it you can visualize your JMX metrics OOB.
This link contains the list of the metrics you can obtain from JMX.
References
[1] https://docs.mulesoft.com/runtime-manager/jmx-service
[2] https://docs.datadoghq.com/integrations/java/?tab=host#metric-collection
[3] https://docs.oracle.com/javase/8/docs/technotes/guides/management/agent.html
DATADOG MULE® INTEGRATION
System Architecture | Ports
Ports and Hostnames to whitelist
The Datadog Mule® Integration must have internet connection on port 443 for outbound connections at least.
In enterprises, it’s very common that all networks are behind a firewall to protect access. In many other cases, reverse proxies are used to protect outbound communications to restricted websites. Customers must configure rules in the firewall and proxies to ensure the communication to all IO Connect Services, Anypoint and Datadog.
IO Connect Services Networking Requirements
The Datadog Mule® Integration does a license check via SSL and hence it requires outbound access to:
https://api.ioconnectservices.com/
Port: 443
This is an outbound communication only and it’s initiated by the Datadog agent running on-premise.
MuleSoft Anypoint Networking Requirements
Communication from Mule servers, installed on-prem, must allow inbound and outbound connections to the following DNS names via port 443 (HTTPS) and 9999 (configurable websocket).
Here is a full list of the FQDNs that need to be whitelisted. Pick the ones corresponding to the region to which you MuleSoft organization belongs to.
- anypoint.mulesoft.com
- eu1.anypoint.mulesoft.com
- mule-manager.anypoint.mulesoft.com
- mule-manager.eu1.anypoint.mulesoft.com
- runtime-manager.anypoint.mulesoft.com
- runtime-manager.eu1.anypoint.mulesoft.com
- arm-auth-proxy.prod.cloudhub.io
- arm-auth-proxy.prod-eu.msap.io
- data-authenticator.anypoint.mulesoft.com
- data-authenticator.eu1.anypoint.mulesoft.com
- analytics-ingest.anypoint.mulesoft.com
- analytics-ingest.eu1.anypoint.mulesoft.com
- exchange2-asset-manager-kprod.s3.amazonaws.com
- exchange2-asset-manager-kprod-eu.s3.eu-central-1.amazonaws.com
Learn more about the MuleSoft Anypoint networking requisites in https://docs.mulesoft.com/runtime-manager/rtm-agent-whitelists
Datadog Networking Requirements
Communication from Datadog agent, installed on-prem, must allow outbound connections to *.datadoghq.com via port 443 (HTTPS). Other ports might be used for specific use cases.
The FQDNs that need to be whitelisted are:
- trace.agent.datadoghq.com: APM
- process.datadoghq.com: Live containers
- *.agent.datadoghq.com: Log collection
- api.datadoghq.com: Non-critical functions such as checking API Key validity
Modern firewalls can whitelist request based on OSI's layer 7.
Also, you can find these requisites in Datadog site, they are well documented. https://docs.datadoghq.com/agent/guide/network/?tab=agentv6v7
To know the full list of IP ranges that Datadog uses, see the following sites.
In Datadog, all communication is outbound, meaning the agent sends data to Datadog and Datadog never requests to client servers.
All communication is done through these ports:
- 443/TCP: port for most Agent data. (Metrics, APM, Live Processes/Containers)
- 123/UDP: Network time protocol (NTP)
- 10516/TCP: port for the Log collection over TCP for Datadog US region, 443/tcp for the Datadog EU region.
- 10255/TCP: port for the Kubernetes http kubelet
- 10250/TCP: port for the Kubernetes https kubelet
The only inbound communication needed is to send data to agents within the same network, like it's the case of APM configured in a Mule application using the Datadog APM Connector to trace processes.
- 5000/TCP: port for the go_expvar server
- 5001/TCP: port on which the IPC api listens
- 5002/TCP: port for the Agent browser GUI to be served
- 8125/UDP: dogstatsd
- 8126/TCP: port for the APM Receiver