DATADOG MULE® INTEGRATION
RTF Operations
Operations: RTF Infrastructure
This dashboard is divided into three main sections that provides a view of your Runtime fabric applications infrastructure’s health and performance.
Section 1. CRITICAL
Contains applications with critical status:
- Stopped applications: Applications that are not running.
- Clusters degraded: Clusters that are experiencing performance issues.
- Clusters disconnected: Clusters that are unable to communicate.
- Nodes with status not healthy
- Nodes with status not ready
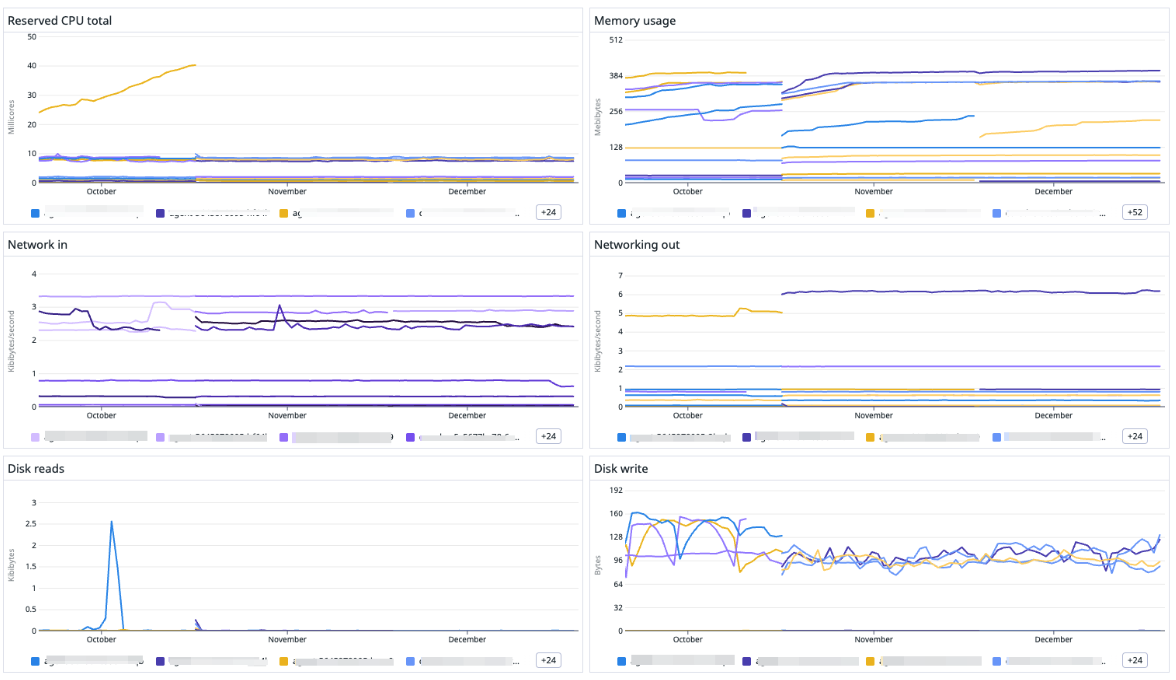
Section 2. APPLICATION RESOURCES OVERVIEW BY REPLICAS
Analyze CPU and memory metrics to ensure efficient resource utilization, to ensure resource utilization. Track storage access, network activity, data read/write operations.
Pro tip:
Configure the MuleSoft application variable to analyze resource for each replica used by the application variable.
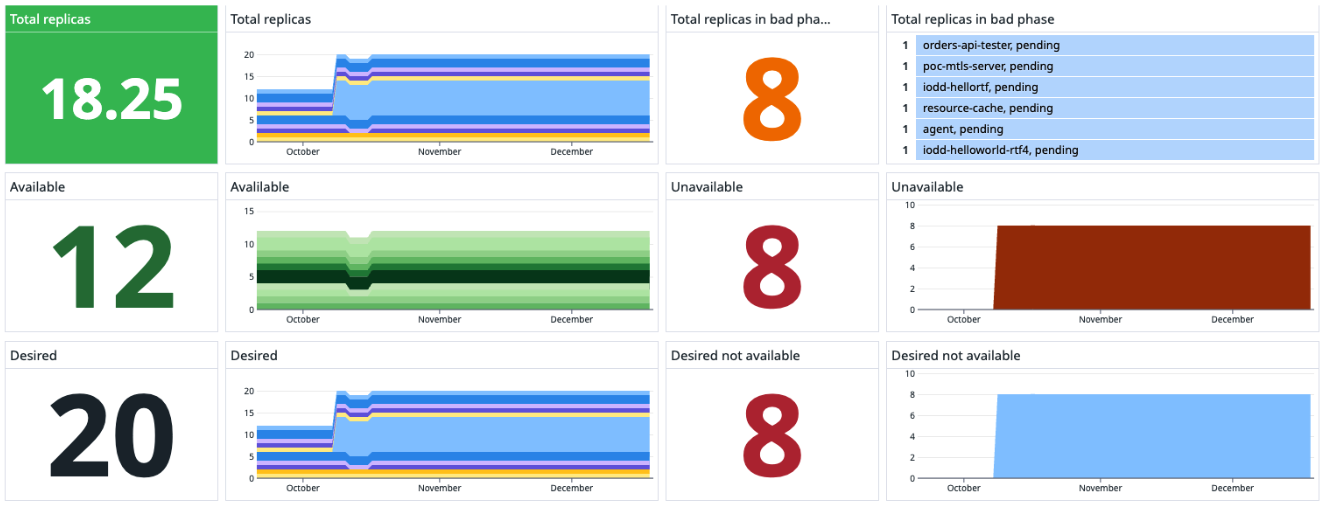
Section 3. REPLICAS OVERVIEW
This section provides a comprehensive view of your application's replicas, high availability, and resilience. Metrics include:
- Total replicas: The total number of replicas currently running.
- Replicas in bad phase: Replicas experiencing issues.
- Available vs. unavailable replicas: A quick glance at replicas currently serving traffic vs. those that are not.
- Desired replicas: The count of replicas you aim to have up and running.
- Desired not available: Difference between the desired and actual number of replicas, indicating potential deployment issues.
Operations: RTF Resource allocation and usage
This dashboard displays the resources consumed by your applications per environment, providing valuable insights into resource utilization. It is divided into three sections:
Pro-tip:
Configure the MuleSoft environment identifiers (production Environment and sandbox Environment) and save the view. See how you can obtain the identifiers and save the view in the Datadog dashboard in the pre-requisites.
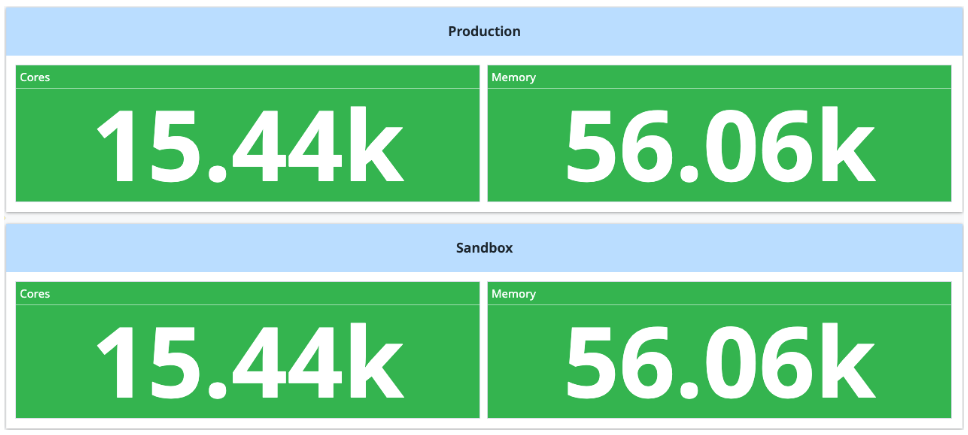
Section 1. Environment resources
Shows the total cores and memory used by applications in production and sandbox environment.
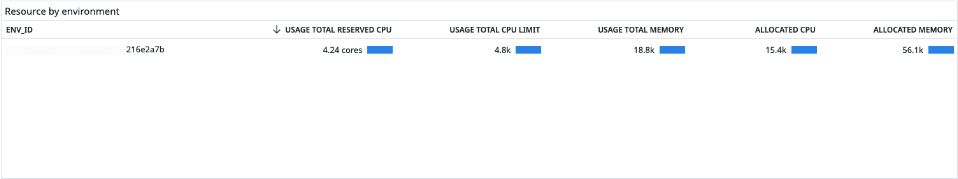
Section 2. Environment details
This table categorizes resources by environment:
- Usage total reserved CPU.
- Usage total CPU limit.
- Usage total memory.
- Allocated CPU.
- Allocated memory.
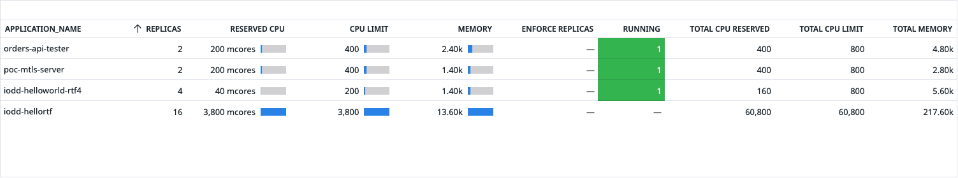
Section 3. Environment application resources
Focuses on resources from RTF (Runtime Fabric) applications.
- Replicas
- Reserved CPU
- CPU limit
- Memory
- Enforced active replicas
- Running
- Total CPU reserved
- Total CPU limit
- Total memory